


Client
A large German energy and telecom provider used Elinext to build software for planning fiber-optic networks on a map.
Challenge
Every meter of fiber-optic cable costs around 80 euros. So, naturally, cutting the length of cable required is a great way to reduce costs for telecommunication companies. One such company based in Germany tried to do so by building a digital tool that would improve the way they planned cable coverage on the map.
The product they originally built, however, wasn’t saving as much money as they hoped it would. That made the company look for a software development partner who could upgrade the tool, and the search led to Elinext.
From the beginning, we showed confidence in using Java and the related tech stack. The fact that we had provided a project manager and a business analyst who both spoke German gave the company yet another reason to try Elinext -- and so they did.
Process
We organized the work into sprints with ongoing delivery. Along the way, we have regularly had virtual meetings with the client to coordinate the development.
The Test
The client wanted to see first if we could improve what they had already been building. And that was a routing service they asked us to build to compare with the one they already had. That took us just one month to do.
The routing service we built impressed the client, convincing them we were the right choice for a developer to continue with.
Saving More Money With a New Algorithm
The deeper our team got involved, the better our understanding of the product and its goals we had. At some point, that helped further reduce the amount of cable required to build networks.
Impressed with the potential savings, the client green-lighted replacing the old algorithm with the new one and adding other improvements.
Product
Let’s look at how the system works from the perspective of the provider’s planner who needs to connect new buildings to the network.
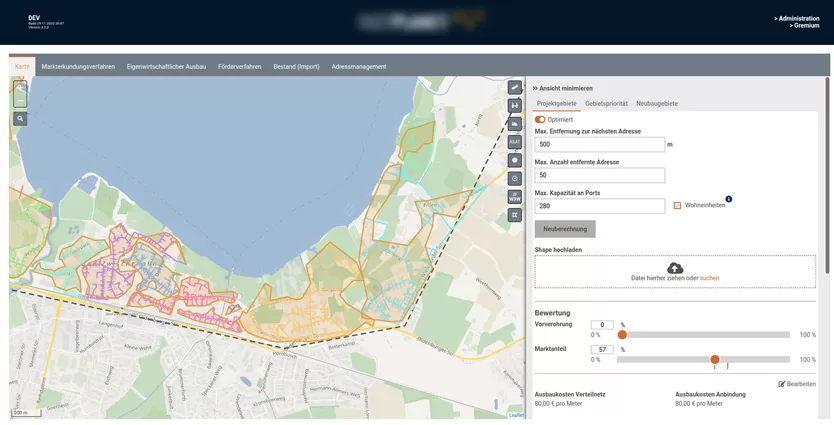
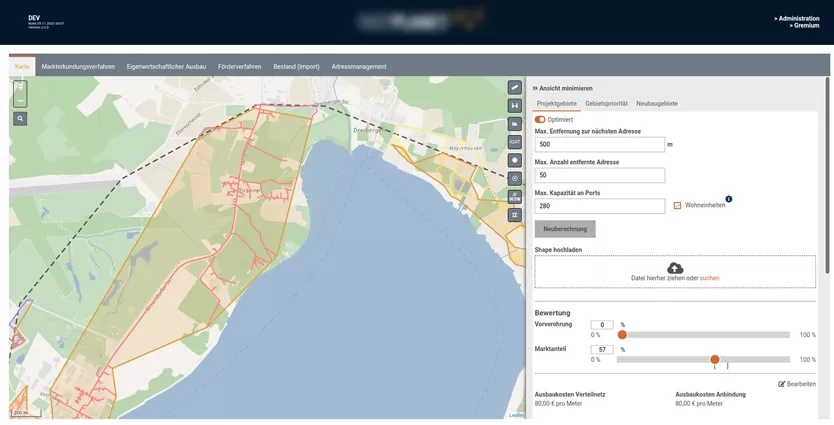
The Map
The first thing the planner will see when they start the app is the map. It will show them roads, which are prerequisites to installing cable, buildings, and terrain features like lakes or hills. The information displayed on the map is pulled from an API related to OpenStreetMap.
As the planner’s main work, the map provides different tools and layers. Let’s take a closer look.
Current Infrastructure
The cable is placed in an underground system consisting of a cable pipe. And the information about the currently existing pipes is available to the telecom provider through the official registry.
The network planner can view this underground infrastructure by switching to the respective map layer. The pipes will appear as black branches going in all directions across the land.
Current Cable
If there’s an infrastructure, some cable would be expected to be already placed in it. In this system, the planner is offered another layer that will allow them to follow the currently installed optical fiber across the map.
Wiring Cabinets
Cables need to be connected to the source. This is achieved by placing wiring cables, from which branches of cabinets stem, across a territory.
To see the existing cabinets on the map, the planner can switch to the respective layer, and they will appear as red triangles. The application will also display blue triangles suggesting economically viable locations for prospective cabinets.
Zoning by Status
Before planning a new addition to the network, the planner will want to get a bigger picture of the target territory in terms of economy. They will want to see three types of zones:
- where developing the network would be economically viable;
- where funding is already on the way; and
- where the expansion of the network is not feasible for various reasons.
The map we built allows the planner to see exactly that. They can switch to the zone layer and see three sublayers corresponding to each zone type (blue, green, and orange, respectively).
Ruler
In some cases, the telecom provider may need to double-check calculations or do custom measurements on the map. And this is where the Ruler tool, as simple as it is, comes in handy.
what3words
People involved in developing an area, from planners and managers to field engineers, may struggle when talking about that area. To make things easier, we implemented the what3words (W3W) layer.
The W3W concept provides an international system of naming sectors on a map. It divides the whole world into three-meter squares, and each square has a name: three random words. We connected the application to W3W API, creating a layer with the three-name-squares grid superimposed on the map.
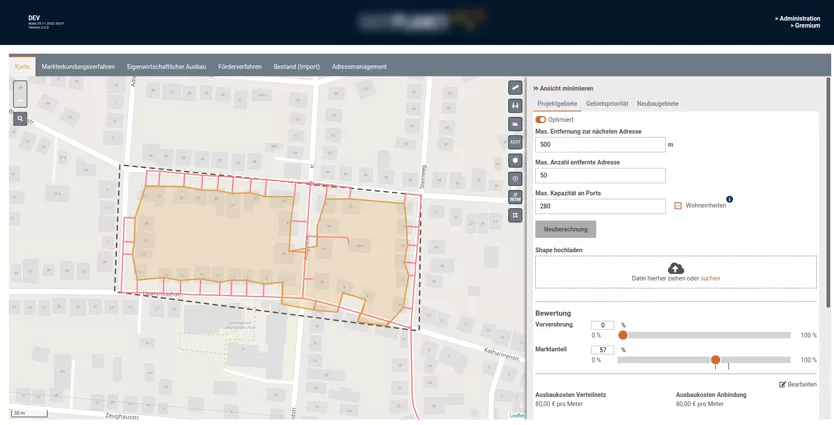
Planning the Network on the Map
Planning starts with outlining a polygon-shaped sector around the addresses the planner needs to add to the network. Once this has been done, they’ll see various colored lines within the sector, suggesting optimal cable installation routes.
Clusters
Each color represents a particular cluster of addresses that are pulled from the national registry and combined automatically. The system combines addresses into a cluster around a nearby wiring cabinet that has enough capacity to support consumers at these addresses.
Calculating Capacity Against Cable Length
As a point on a map, every address has its weight, measured in the number of customers at this address. For example, if it’s a block of flats, the weight will be calculated from the number of flats in the block.
The system will factor in the weight of building routes. If a nearby wiring cabinet can’t provide enough capacity, the planner has two options: build a new cabinet in the area or use a cabinet located further away. The system will calculate which option is less expensive for the planner.
Route Deviations and Alternatives
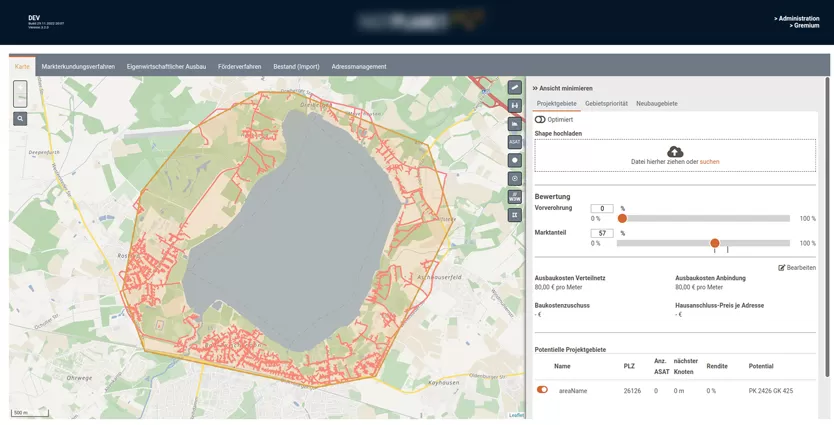
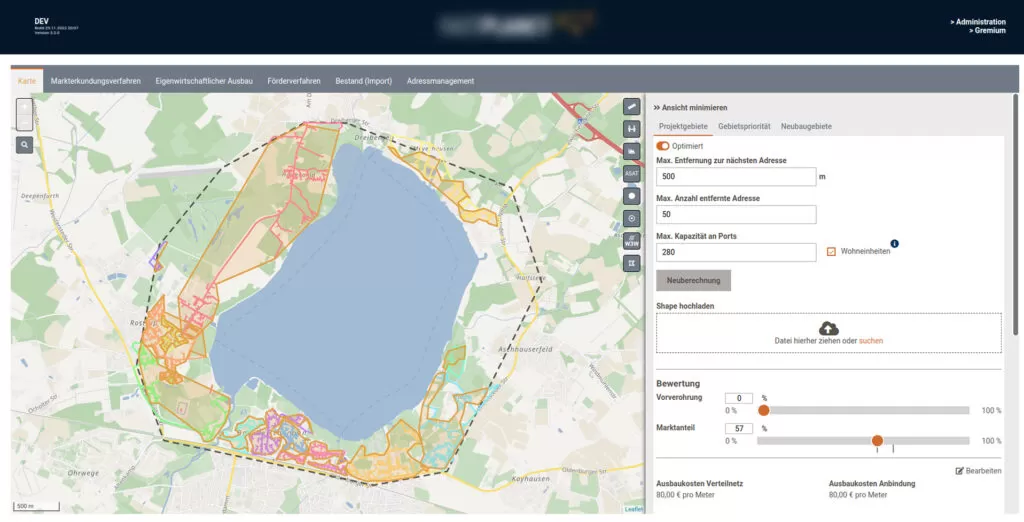
As the planner maps out the network, they will be able to configure various parameters. For instance, they can choose to either bypass terrain obstacles or include them in suggested cable routes.
Sometimes the polygonal sector may not include all the best (or viable) potential cable routes. In these cases, the system will suggest routes that are a bit off the sector.
The map and suggested routes are as close to the territory and the actual underground conduit system as it gets. The planner may come across discrepancies but they’ll be too insignificant to pose a problem.
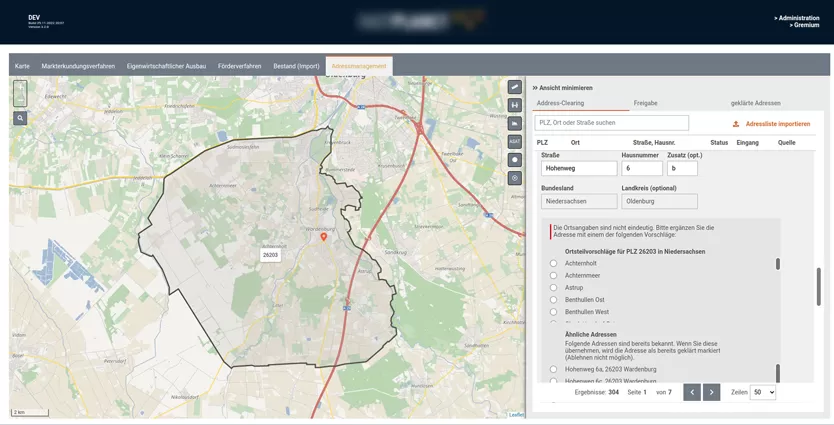
Address Management
The planner usually enters addresses into the system by uploading them as a list in the address management section. But if someone filling out the list made mistakes in spelling the addresses, the system will not find matches on the map. To help prevent that, we introduced address clearing.
The address-clearing subsection includes post indexes, places, and streets. In addition, each address is accompanied by its status (e.g. in processing, new or under construction), entry date, and source. And here’s how this works.
When the planner outlines a polygon and creates a new network development project, the planner can configure a slew of parameters. These include the project name, start and end dates, telecommunication provider, and more.
The planner will also see the address management panel showing addresses included in this sector. Within this panel, the planner can add and remove locations. And if they add an invalid location, the system will warn them. This address will appear as stricken through and the planner will see an alert saying this location won't be included in calculations. What the planner will need to do is find the coordinates of the building in question and enter them into the respective field. Next, they can go back to the list of addresses and click on the invalid entry. In the entry screen, they’ll see alternative address suggestions and a field for coordinates. Once the coordinates have been pasted into the respective field, the planner will be able to save changes. The system will recognize the correct address and suggest replacing the invalid one with it.Results
Our client has liked working with us. This is evident by how they have been gradually increasing our participation, replacing their local staff with Elinext people lately.
The product is actively promoted, advertised, and used. New telecom partners regularly get on board, contributing to the growth of the product. And we’re always there to further boost it and fix any issues.