


Client
A startup from the UK commissioned Elinext to build an environmental, social and governance (ESG) system.
Challenge
Happy workers perform the best. But ensuring employees are happy across a large organization is a challenge: the employer needs to talk to so many people — and do so often.
One British startup had an idea for an environmental, social and governance (ESG) system that could simplify the task. They conceived it as a channel through which employees could systematically signal to their employers how they felt about their workplace.
The founders already had an ecosystem of corporate applications, including factoring software that Elinext helped them build. So, at the point of building a new product, it was only natural to choose us as a developer.
Process
Our client’s CTO preferred to avoid formal development structures like Scrum, and we had already adapted to their approach. We tracked the process through Microsoft Azure using tickets, stories and other basic practices.
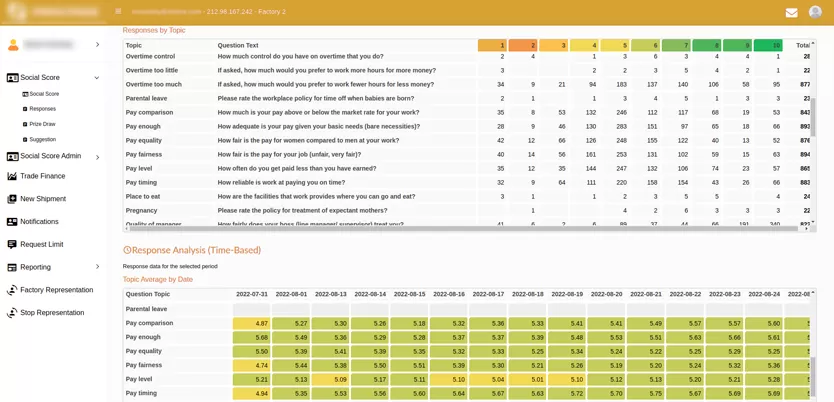
The mechanics of the system were as follows: employees complete surveys and the employer gets respective analytics. However simple this may sound, our client had a lot of features in mind. For instance, every question belonged to a particular category and the answer would show a satisfaction score within this category.
Employees’ answers would further be used in complex calculations for comprehensive analytics. And that’s what made for the main challenge — figuring out the metrics, what they meant and how to use answers in the calculations. Moreover, our client refined the list of features several times as we built the product.
To ensure all calculations worked as expected, we checked the application through both automated and manual tests.
Product
The system we developed consists of two applications: web and mobile.
The web application is the tool for employers using the system. And it runs on a microservice-based architecture using Java and Angular. The mobile app runs on Android and is designed as a survey interface for employees.
The Employee Interface
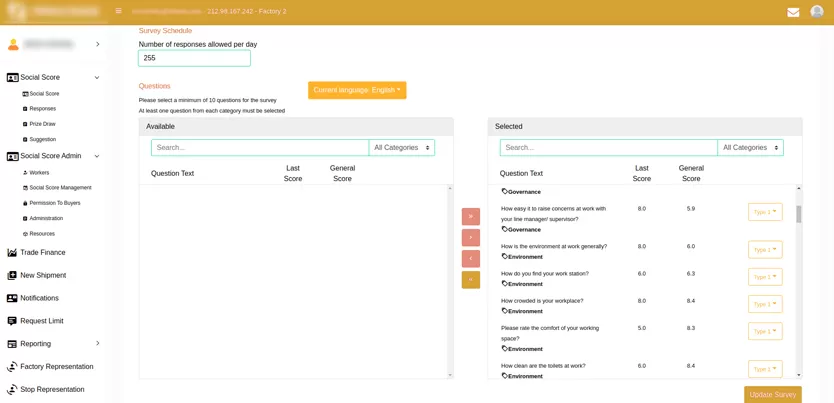
Once a worker has logged into the mobile app, they’ll be presented with a survey of ten questions formulated as statements. They can choose from one to ten to specify how accurately a particular statement describes their feelings about their workplace.
The Employer Interface
The web application we built for employers includes a lot of dashboards, reports and configuration pages.
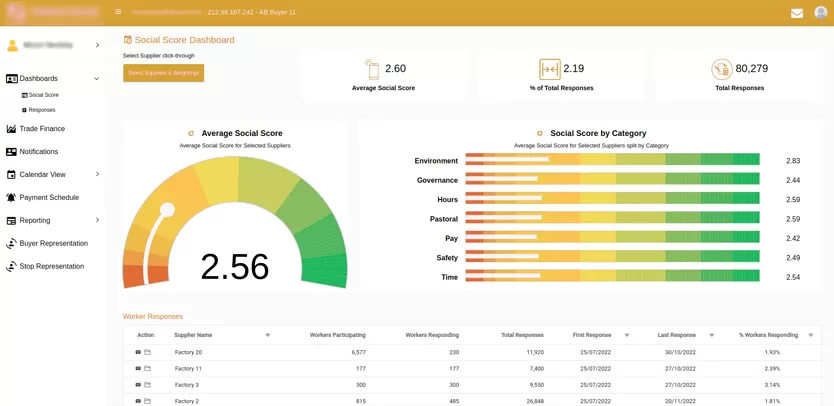
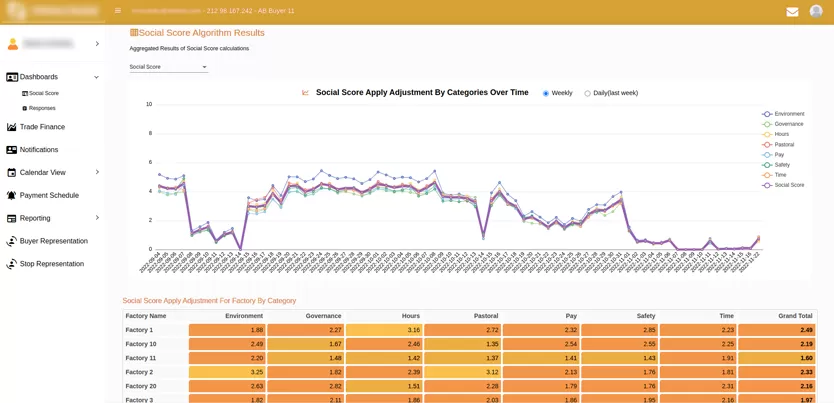
Social Score Dashboard
The main dashboard, a.k.a. the social score dashboard, features diagrams and graphs related to various workplace aspects by satisfaction over time. These span the environment, governance, work hours, pay, safety and more. Each of these aspects hinges on particular answers as superimposed on the parameter monitoring table.
To study compliance, the employer can review metrics like the average number of daily responses or responses per question. And to improve compliance, we put together a reward system.
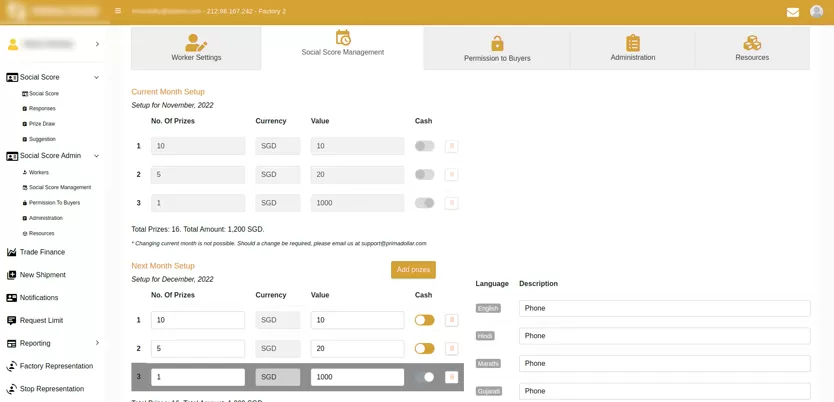
The Compliance Reward System
An employer can organize drawings for prizes, encouraging their staff to compete for a mobile phone or other valuable things. An employee has to answer frequently and their answers have to be consistent and trustworthy. Afterward, it is expected that the organization will have multiple employees eligible for a prize, so a number of them (depending on how many prizes are available during this period) are selected randomly (but the selection is not completely random; for example, the selection process takes into consideration if a certain employee has already won a price recently and for how long they’ve been participating in surveys).
In the process, the system will determine how consistent and trustworthy each participant’s answers are. Combining these estimates with the number of answers, it will rate each employee, and the top-rated one will be considered the winner.
If an employer uses prize giveaways in their organization, they will see detailed statistics related to the contests. Those stats will let them know how much money has been spent through a particular period, how many employees participated and when, and more.
Results
It took us around a year to build, polish and finalize the current version of the product. Today, we are doubling down on improving the graphs and dashboards.
The client has been able to improve their staff management by helping people be heard and acting on their concerns.
This project taught us a few things about implementing calculations across a slew of parameters. And just as important, we got a deeper understanding of personnel management — how it’s planned, done and measured.