

In modern custom software development, microservices architecture has gained immense popularity due to its ability to break down complex applications into smaller, manageable services. Along with this trend, effective monitoring of these microservices has become paramount for ensuring their smooth operation and optimal performance. In this article, we’ll explore how to develop a Spring Boot application using microservices architecture and implement monitoring using popular tools like Prometheus and Grafana.
What is Microservices Monitoring?
Microservices architecture has become increasingly popular in modern software development due to its flexibility, scalability, and resilience. However, as applications grow more distributed and complex with multiple microservices interacting with each other, monitoring becomes paramount to ensure their smooth operation. In this article, we’ll explore what microservices monitoring is, why it’s important, and provide examples of monitoring strategies and tools.
Understanding Microservices Monitoring
Microservices monitoring involves the process of tracking and monitoring the behavior, performance, and health of individual microservices within a distributed system. It includes collecting various metrics, logs, and traces of microservices and analyzing them to gain insight into their functioning. The main tasks of microservices monitoring are:
- Detecting Issues: Monitoring helps identify and detect issues such as performance bottlenecks, errors, and failures in microservices. Early detection of these problems allows timely intervention and prevents them from escalating into more serious problems.
- Performance Optimization: By monitoring key performance metrics like response times, throughput, and resource utilization, developers can identify areas for optimization and fine-tune the performance of microservices to enhance overall system efficiency.
- Ensuring Availability: Monitoring ensures that microservices are available and responsive to handle incoming requests. It helps in identifying downtimes, outages, and service disruptions promptly, allowing problems to be resolved quickly and minimizing service downtime.
- Scaling and Capacity Planning: Monitoring metrics related to resource usage, traffic patterns, and microservice load enables effective scaling and capacity planning. It helps you predict future resource requirements and scaling microservices horizontally or vertically as needed to handle increasing workloads.
Examples of Microservices Monitoring
Metrics Collection:
Metrics collection involves collecting quantitative data about various aspects of microservice behavior and performance. Examples of metrics include:
- Request Latency: The time taken to process incoming requests.
- Error Rate: The percentage of requests resulting in errors.
- Throughput: The number of requests processed per unit of time.
- CPU and Memory Usage: Resource utilization metrics showing the load on microservices.
Tools like Prometheus, Micrometer, and StatsD are commonly used for collecting metrics from microservices.
Log Monitoring:
Logs provide valuable insights into the internal workings of microservices, including debugging information, error messages, and application events. Log monitoring involves aggregating, parsing, and analyzing log data to identify anomalies, trends, and patterns. Tools like ELK Stack (Elasticsearch, Logstash, Kibana), Fluentd, and Splunk are popular for log monitoring in microservices environments.
Distributed Tracing:
Distributed tracing enables you to track the flow of requests passing through multiple microservices in a distributed system. This helps you understand end-to-end request latency and identify performance bottlenecks at different service edges. Tools like Jaeger, Zipkin, and OpenTelemetry provide distributed tracing capabilities for microservices architectures.
Alerting and Notification:
Alerting mechanisms notify developers and operations teams about critical events, anomalies, or deviations from expected behavior in microservices. Alerts can be configured based on predefined thresholds or conditions for metrics such as high error rates, increased latency, or service unavailability. Tools like Prometheus Alertmanager, Grafana, and PagerDuty facilitate alerting and notification in microservices monitoring setups.
Microservices monitoring is essential to maintain the reliability, performance, and availability of microservices-based applications. By continuously monitoring key metrics, logs, and traces, organizations can ensure the smooth operation of their microservices and proactively resolve issues before they impact users. Implementing a comprehensive monitoring strategy using appropriate tools and techniques empowers developers to create resilient and scalable microservices architectures that meet the demands of modern software applications.
Understanding Microservices Architecture
Microservices architecture involves breaking down an application into smaller, independent services, each responsible for a specific set of functionalities. These services communicate with each other via APIs, enabling greater flexibility, scalability, and resilience in the application.
Setting Up a Spring Boot Application
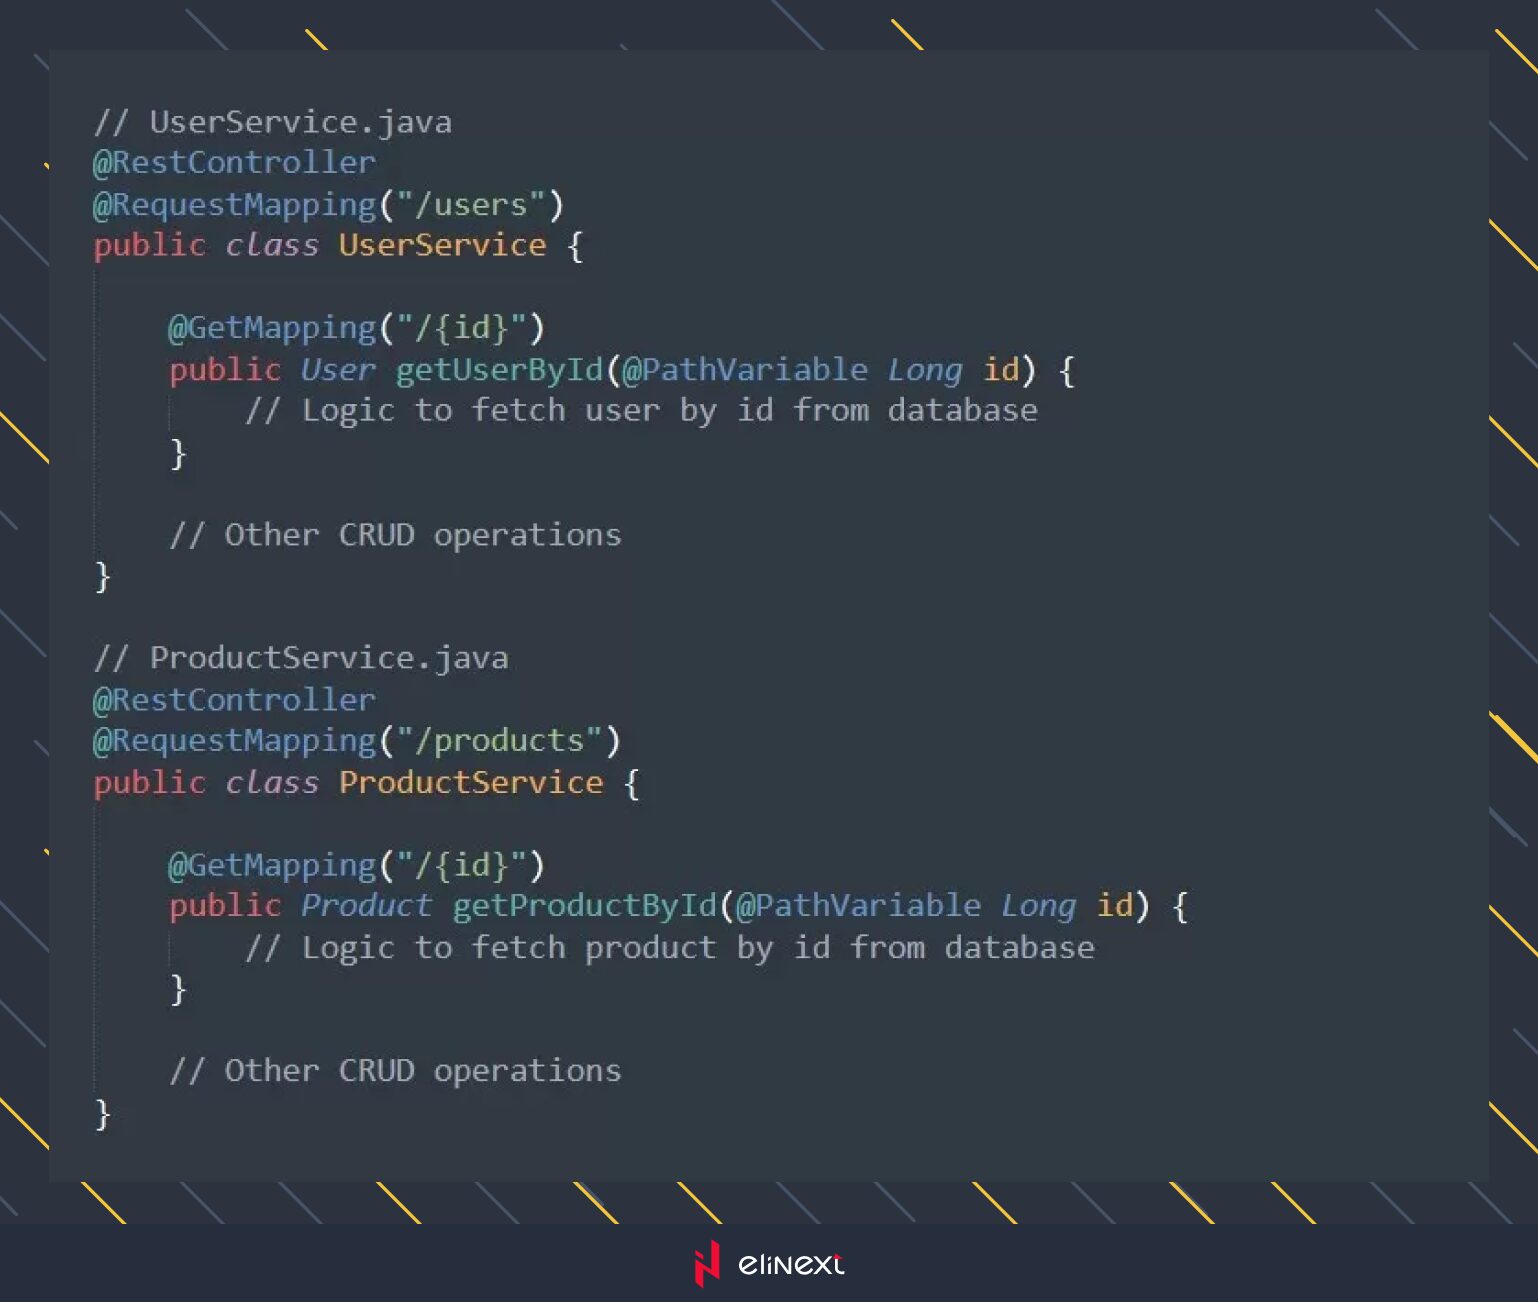
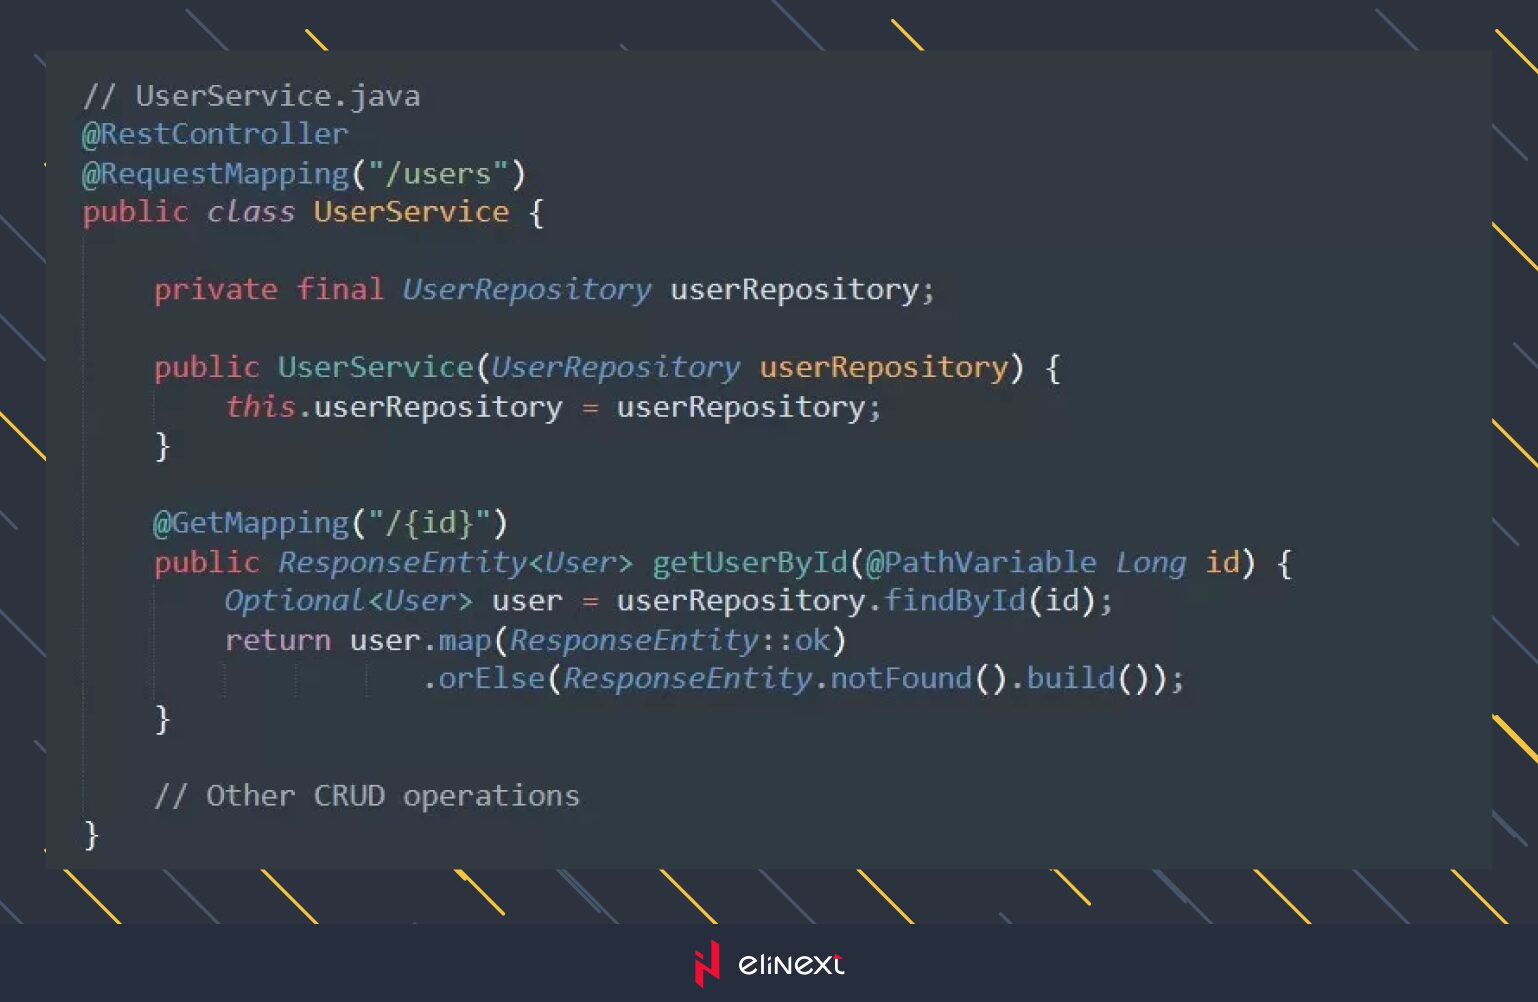
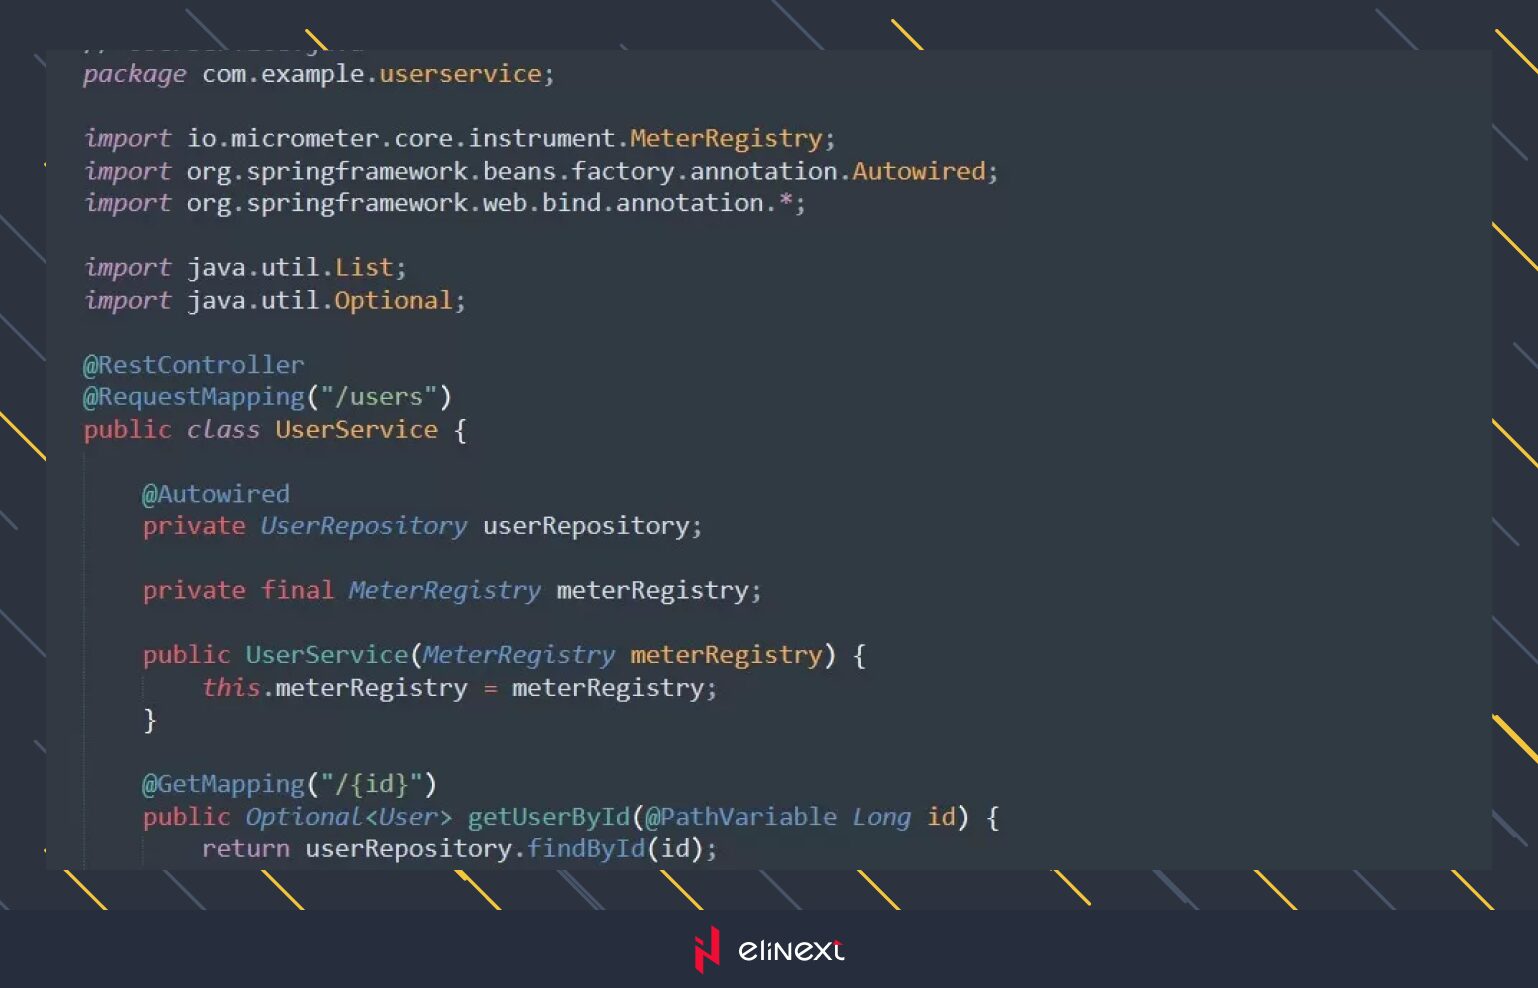
To begin our journey, let’s set up a simple Spring Boot application with two microservices: `UserService` and `ProductService`. We’ll use the Spring Boot website and execution engine starters to create RESTful APIs and monitoring endpoints.
Code Example:

Implementing Monitoring with Prometheus and Grafana
Now that we have our microservices set up, let’s integrate monitoring using Prometheus for metrics collection and Grafana for visualization.
Code Example:
- Add Prometheus and Actuator dependencies to `pom.xml`:

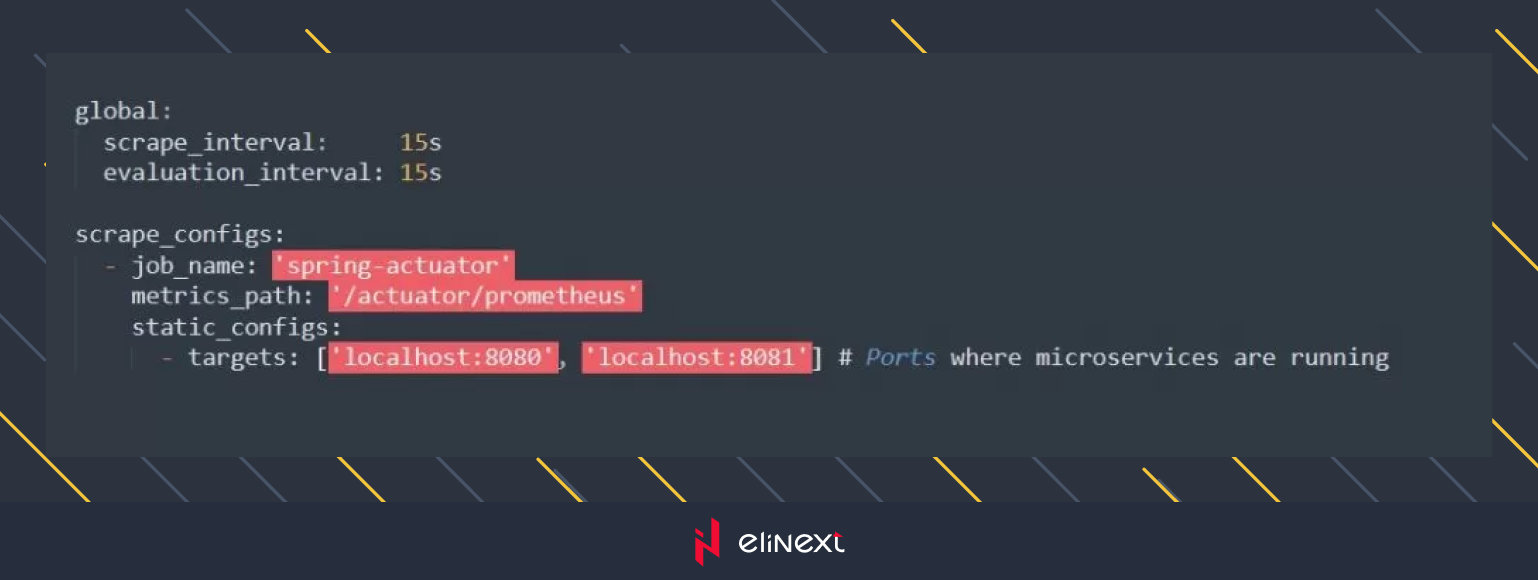
2. Create a `prometheus.yml` configuration file:
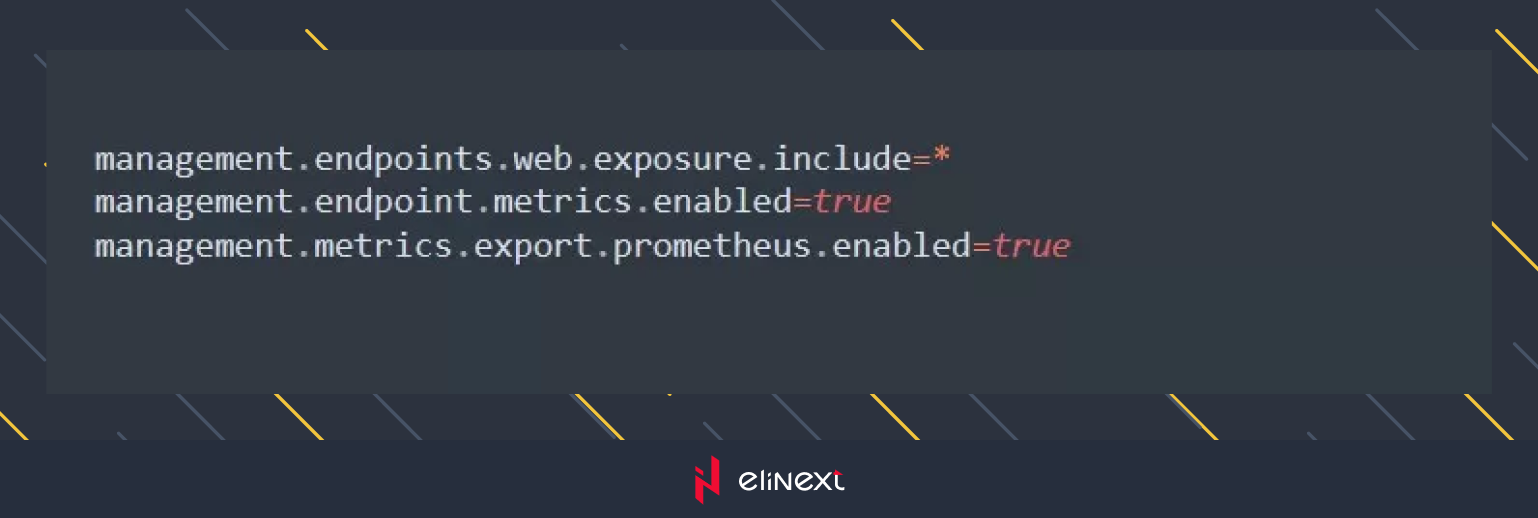
3. Configure Prometheus in `application.properties`:
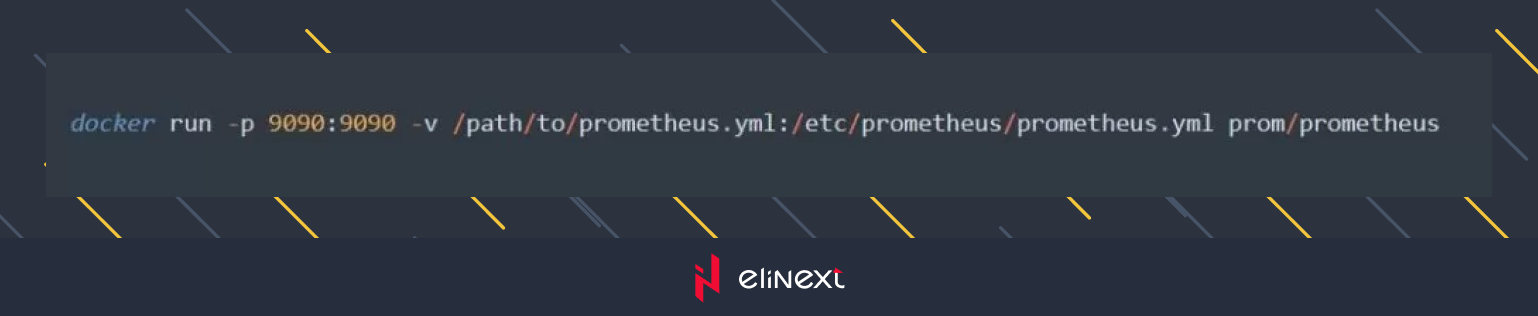
- Run Prometheus server using Docker:
- Set up Grafana to visualize metrics collected by Prometheus.
Let’s delve deeper into how we can utilize Prometheus and Grafana for comprehensive monitoring. We will introduce additional metrics, custom dashboards, and alerting mechanisms to ensure we get the most out of our monitoring setup.
Enhancing the Spring Boot Microservices
Step 1: Extending the Microservices
We will enhance `UserService` and `ProductService` with additional endpoints and metrics.
1.1 Extended UserService
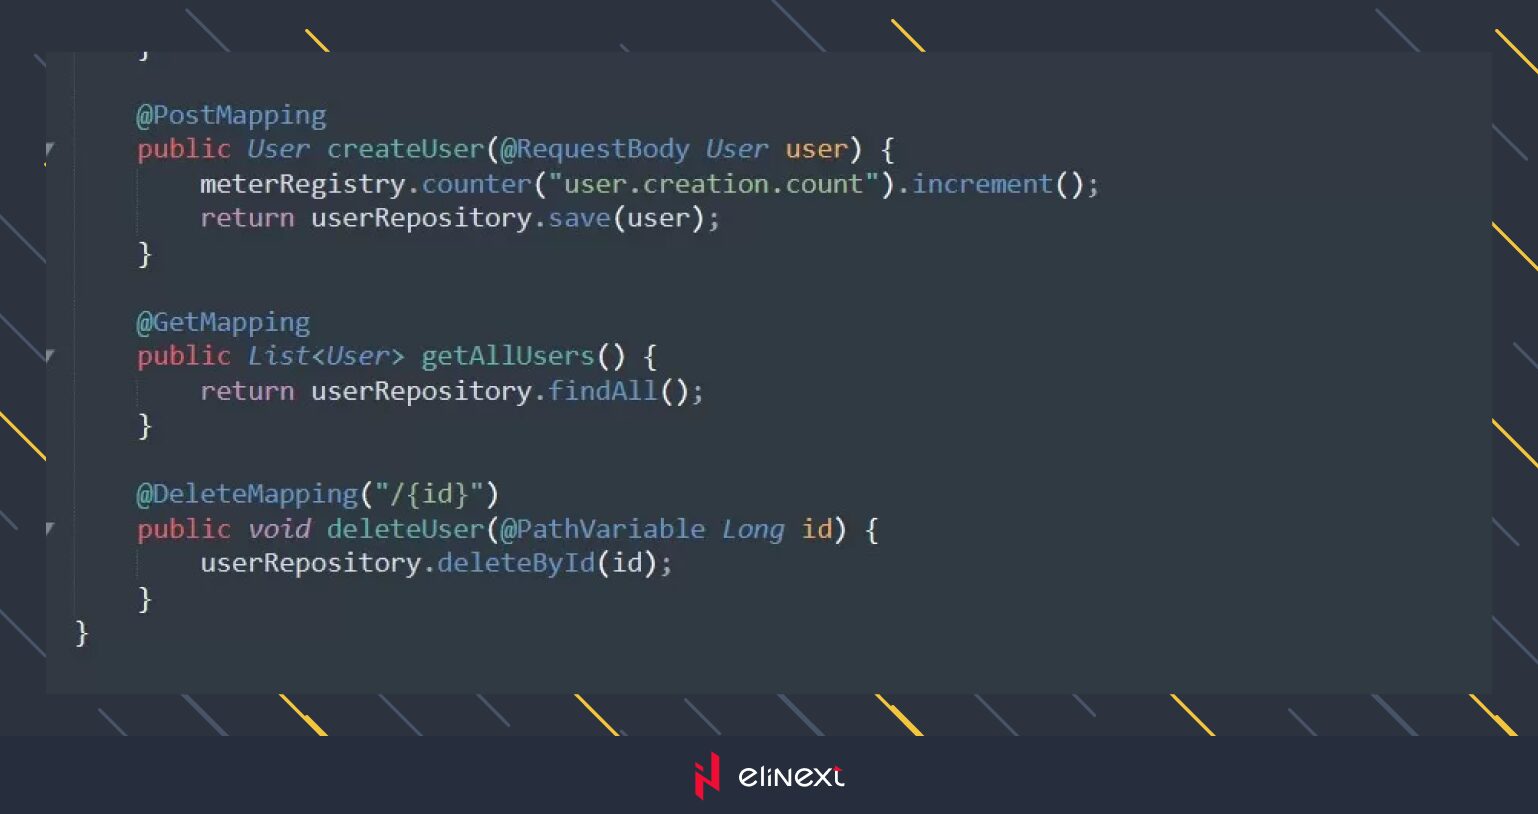
Add endpoints to retrieve all users and delete a user. Also, implement a custom metric for tracking user creation.
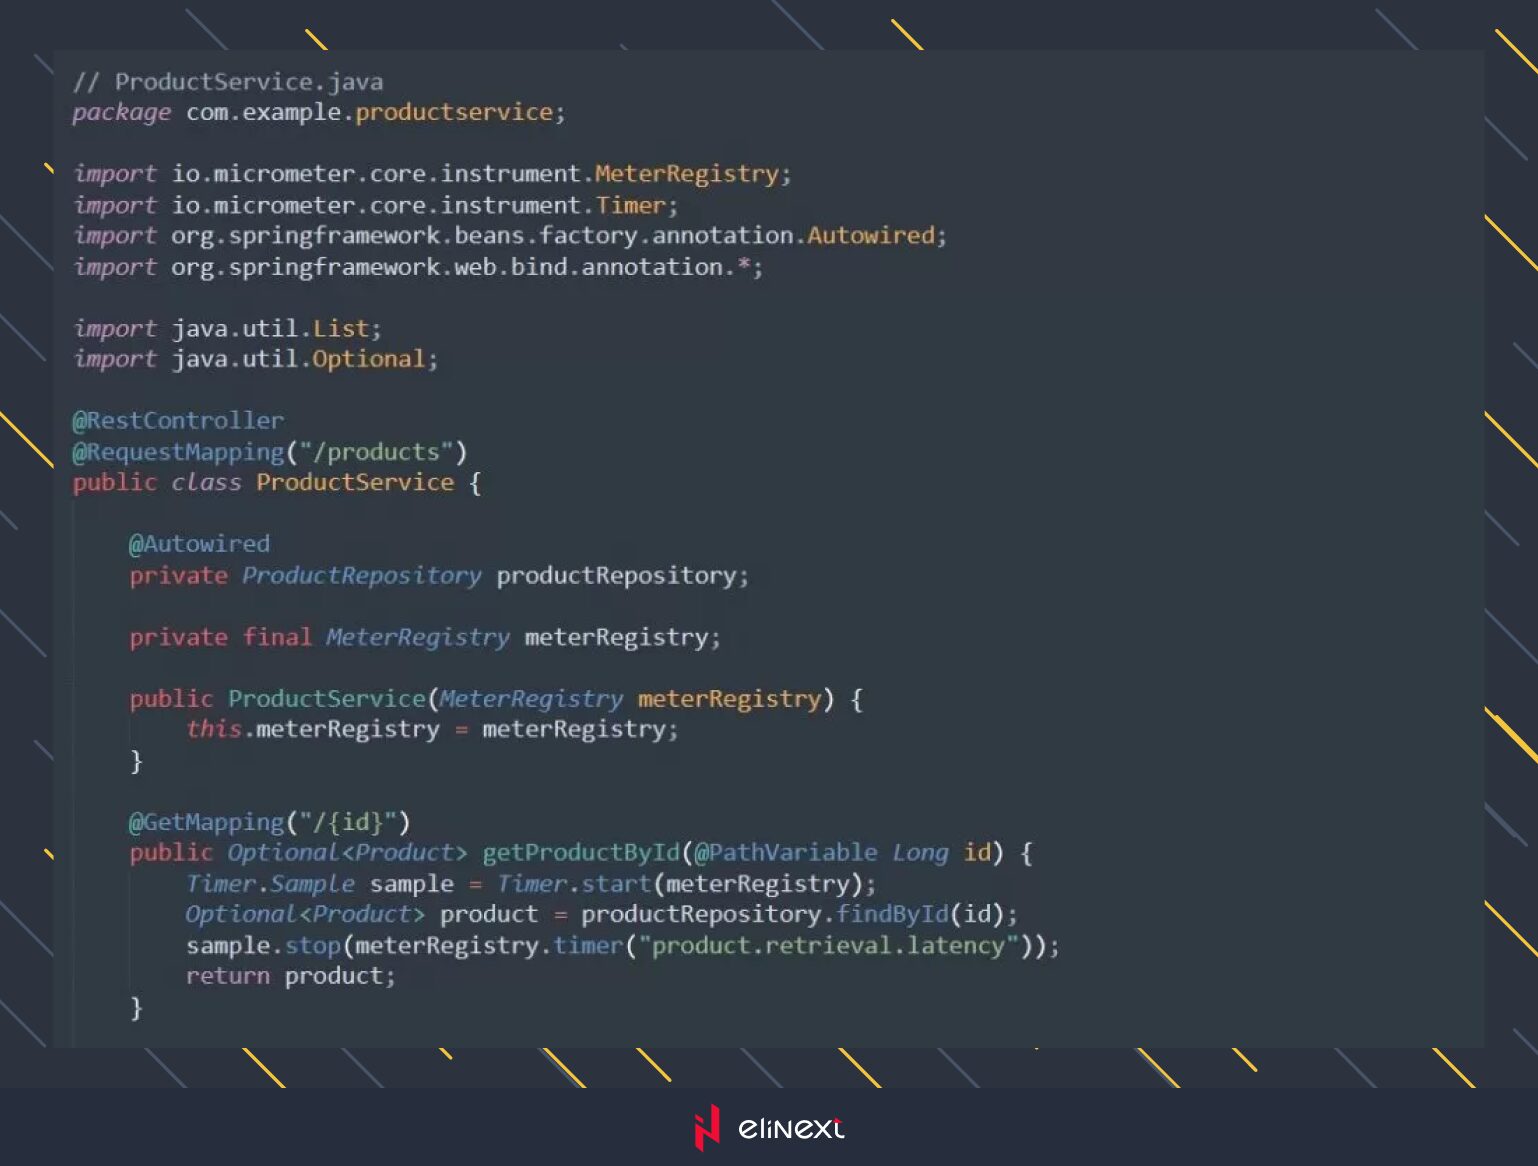
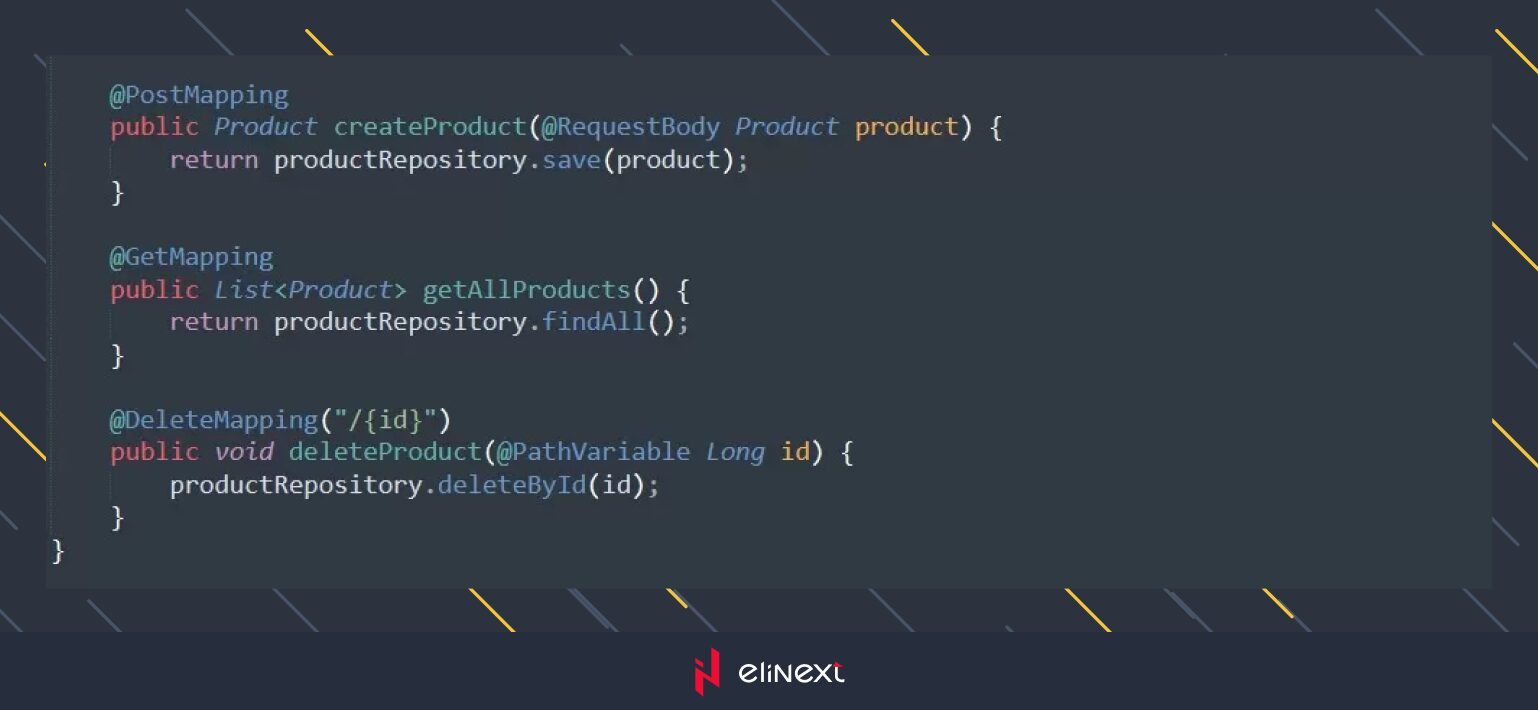
1.2 Extended ProductService
Add endpoints to retrieve all products and remove a product. Also, implement a custom metric to track the delay in product receipt.
Step 2: Advanced Monitoring Configuration
2.1 Prometheus Configuration
Update `prometheus.yml` to include advanced metrics scraping.
2.2 Grafana Dashboard
Create custom Grafana dashboards to visualize the collected metrics. Here are some examples of useful panels:
- Number of users:
- Visualize the total number of users created over time.
- Prometheus Query: `sum(increase(user_creation_count[1m]))`
- Delay in receiving product:
- Display the latency distribution for product retrieval.
- Prometheus Query: `histogram_quantile(0.95, sum(rate(product_retrieval_latency_bucket[5m])) by (le))`
- CPU and Memory Usage:
- Show the CPU and memory usage for each microservice.
- Prometheus Queries: `rate(process_cpu_seconds_total[1m])` and `process_resident_memory_bytes`
- Error Rates:
- Track the error rate of each microservice.
- Prometheus Query: `rate(http_server_requests_seconds_count{status!~”2..”}[1m])`
Step 3: Setting Up Alerting
Configure Prometheus to send alerts based on specific conditions. Here’s an example configuration for alerting on high error rates and latency.
3.1 Prometheus Alerting Rules
Create `alert.rules.yml` to define alerting rules.

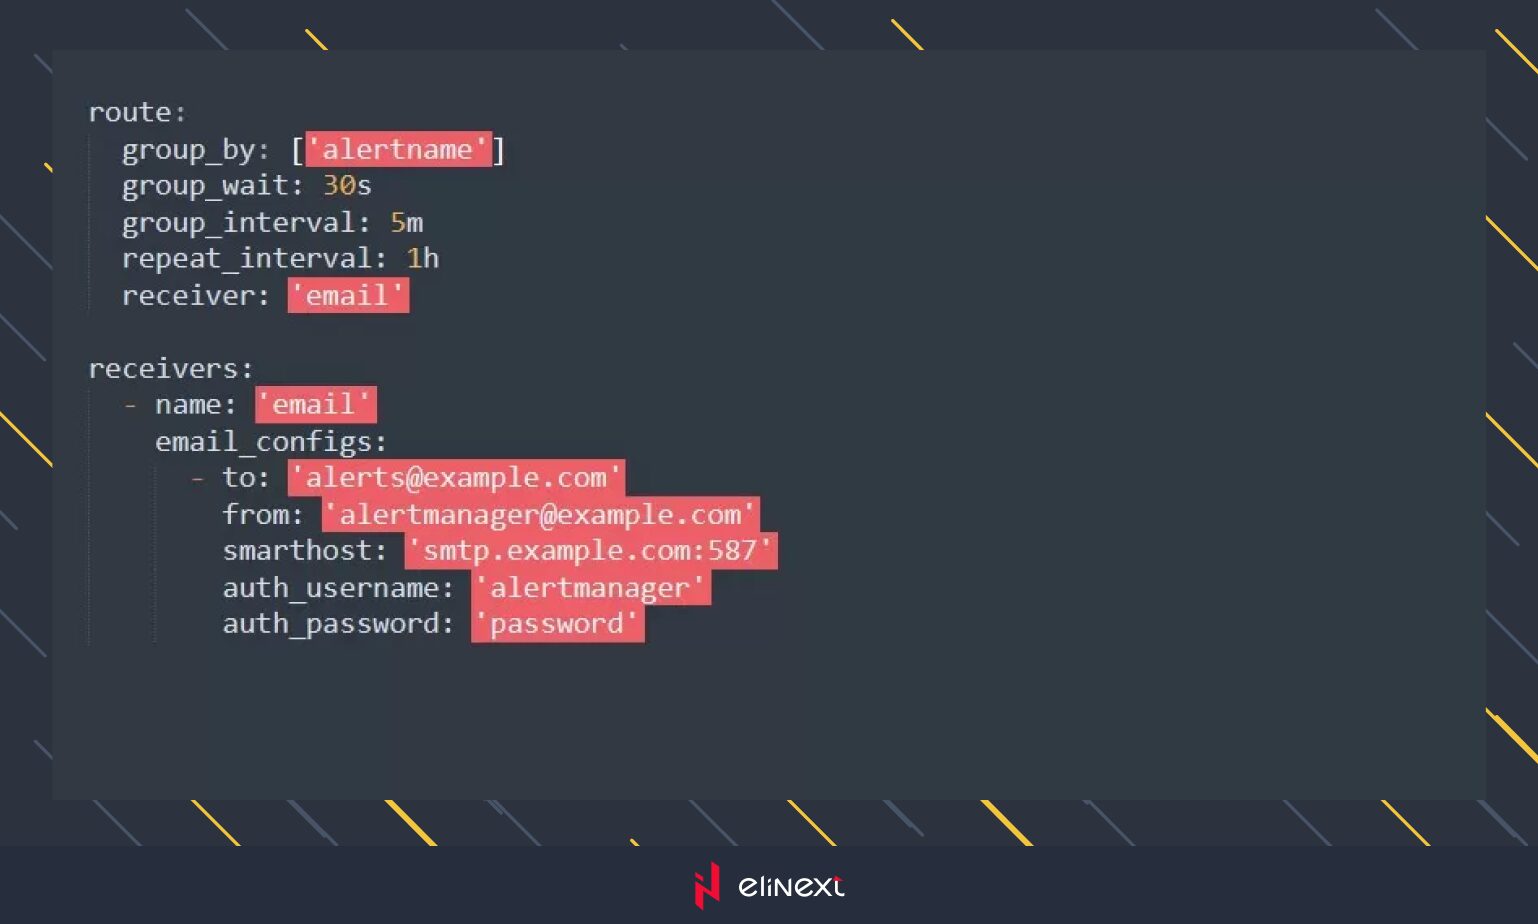
3.2 Configuring Alertmanager
Set up Alertmanager to handle alerts. Create `alertmanager.yml`:
Step 4: Running and Testing the Setup
- Start Microservices:
- Ensure both `UserService` and `ProductService` are running.
- Start Prometheus:
- `docker run -p 9090:9090 -v /path/to/prometheus.yml:/etc/prometheus/prometheus.yml prom/prometheus`
- Start Grafana:
- `docker run -d -p 3000:3000 grafana/grafana`
- Start Alertmanager:
- `docker run -d -p 9093:9093 -v /path/to/alertmanager.yml:/etc/alertmanager/alertmanager.yml prom/alertmanager`
- Test panels and alerts:
- Access Grafana at `http://localhost:3000` to view the dashboards.
- Trigger alerts by simulating high error rates or latency and check for alerts in Alertmanager.
We configured Prometheus to collect detailed metrics and Grafana to visualize these metrics through custom dashboards. In addition, we set up alerting mechanisms to notify us of critical issues. This comprehensive monitoring setup ensures that we can effectively track, analyze, and respond to the performance and health of our microservices, thereby maintaining robust and reliable applications.
Advantages of Microservices Monitoring for Spring Boot Applications
Monitoring microservices in a Spring Boot application offers numerous advantages that are essential for the development, deployment, and maintenance of modern software systems. Let’s delve into some key benefits:
Early Detection of Issues
Microservice monitoring allows early detection of problems such as performance degradation, errors, and bottlenecks within individual services. By continuously monitoring metrics like response times, error rates, and resource utilization, developers can quickly identify and resolve potential issues before they escalate, ensuring optimal performance and reliability.
Improved Visibility and Insights
Monitoring provides developers with in-depth information about the behavior and performance of microservices. By collecting and analyzing metrics, logs, and traces, developers gain visibility into how each service behaves, how they interact with each other, and where potential problems lie. This visibility enables informed decision-making, troubleshooting, and optimization efforts.
Improved Performance Optimization
Monitoring metrics related to CPU usage, memory consumption, and network latency allows developers to identify performance bottlenecks and areas for optimization within microservices. By pinpointing inefficiencies and areas of high resource utilization, developers can optimize code, improve algorithms, and fine-tune configurations to enhance overall performance and efficiency.
Proactive Capacity Planning
Microservices monitoring facilitates proactive capacity planning by tracking resource utilization trends, traffic patterns, and system load over time. By analyzing these trends, developers can anticipate future resource requirements and scale microservices horizontally or vertically as needed to meet growing workloads. This proactive approach to capacity planning helps ensure optimal resource utilization and prevents performance degradation due to resource constraints.
Fault Isolation and Resilience
In a microservices architecture, services are designed to be independent and loosely coupled, allowing failures in one service to be isolated and contained, preventing them from cascading to other services. Monitoring helps identify and isolate errors in individual services, minimizing the impact on the stability and availability of the entire system. By quickly detecting and responding to failures, developers can maintain system stability and functionality, even in case of partial service failures.
Continuous Improvement and Iteration
Monitoring enables a culture of continuous improvement and iteration by providing real-time feedback on the performance and health of microservices. By tracking key metrics and analyzing data, developers can identify areas for improvement, experiment with new features or configurations, and iterate quickly to deliver better user experiences. This iterative development approach promotes innovation, flexibility, and responsiveness to changing requirements.
Conclusion
In this article, we’ve explored the development of a Spring Boot application using microservices architecture and implemented monitoring using Prometheus and Grafana. By integrating these monitoring tools into our microservices ecosystem, we provide greater visibility into the performance and health of our services, thereby facilitating effective management and troubleshooting.
In addition to these practices, mobile app development services play a crucial role in enhancing user engagement and ensuring seamless performance across platforms.
Using these practices not only improves the reliability of our applications but also allows us to provide a superior user experience in the ever-changing landscape of software development.
