




















































































































































Most outages don’t start with a customer calling in. They start on a chip inside a physical switch, sometimes hours before anyone opens a ticket. The data that shows it is often stuck inside a ten-year-old monolith with no clean API and very little documentation.
We talked to our expert, who leads telecom delivery at Elinext, about one project: a 12-year engagement with a multinational telecom hardware and software vendor whose monitoring platform serves thousands of operators. We won’t give you a market overview. This is about what was missed, what got rebuilt, and why telecom analytics only pays off when it sees the whole network. If you’re looking at analytics in the telecom industry beyond dashboards, this is the hands-on version.
The Gap Between Seeing a Problem and Knowing Where It Is
So what was actually broken?
“Honestly? Nothing. Everything was visible, just not in the same place. The client’s platform tracked physical boxes really well. Then operators started building software-defined networks on VMware NSX-T, and virtual switches in the cloud turned into a second world. Most faults still start on the underlay, at the switch chip. Customers feel them on the overlay, in VMs and containers. You end up with two tools, two teams and one incident. That’s usually where data analytics in telecom stalls, and in my view it’s where analytics in the telecom industry loses most of its value.”
Let’s fix that before your customers find out.

Closing the Loop: One Real-Time View, Physical and Virtual Together
How did the team bring the two worlds together?
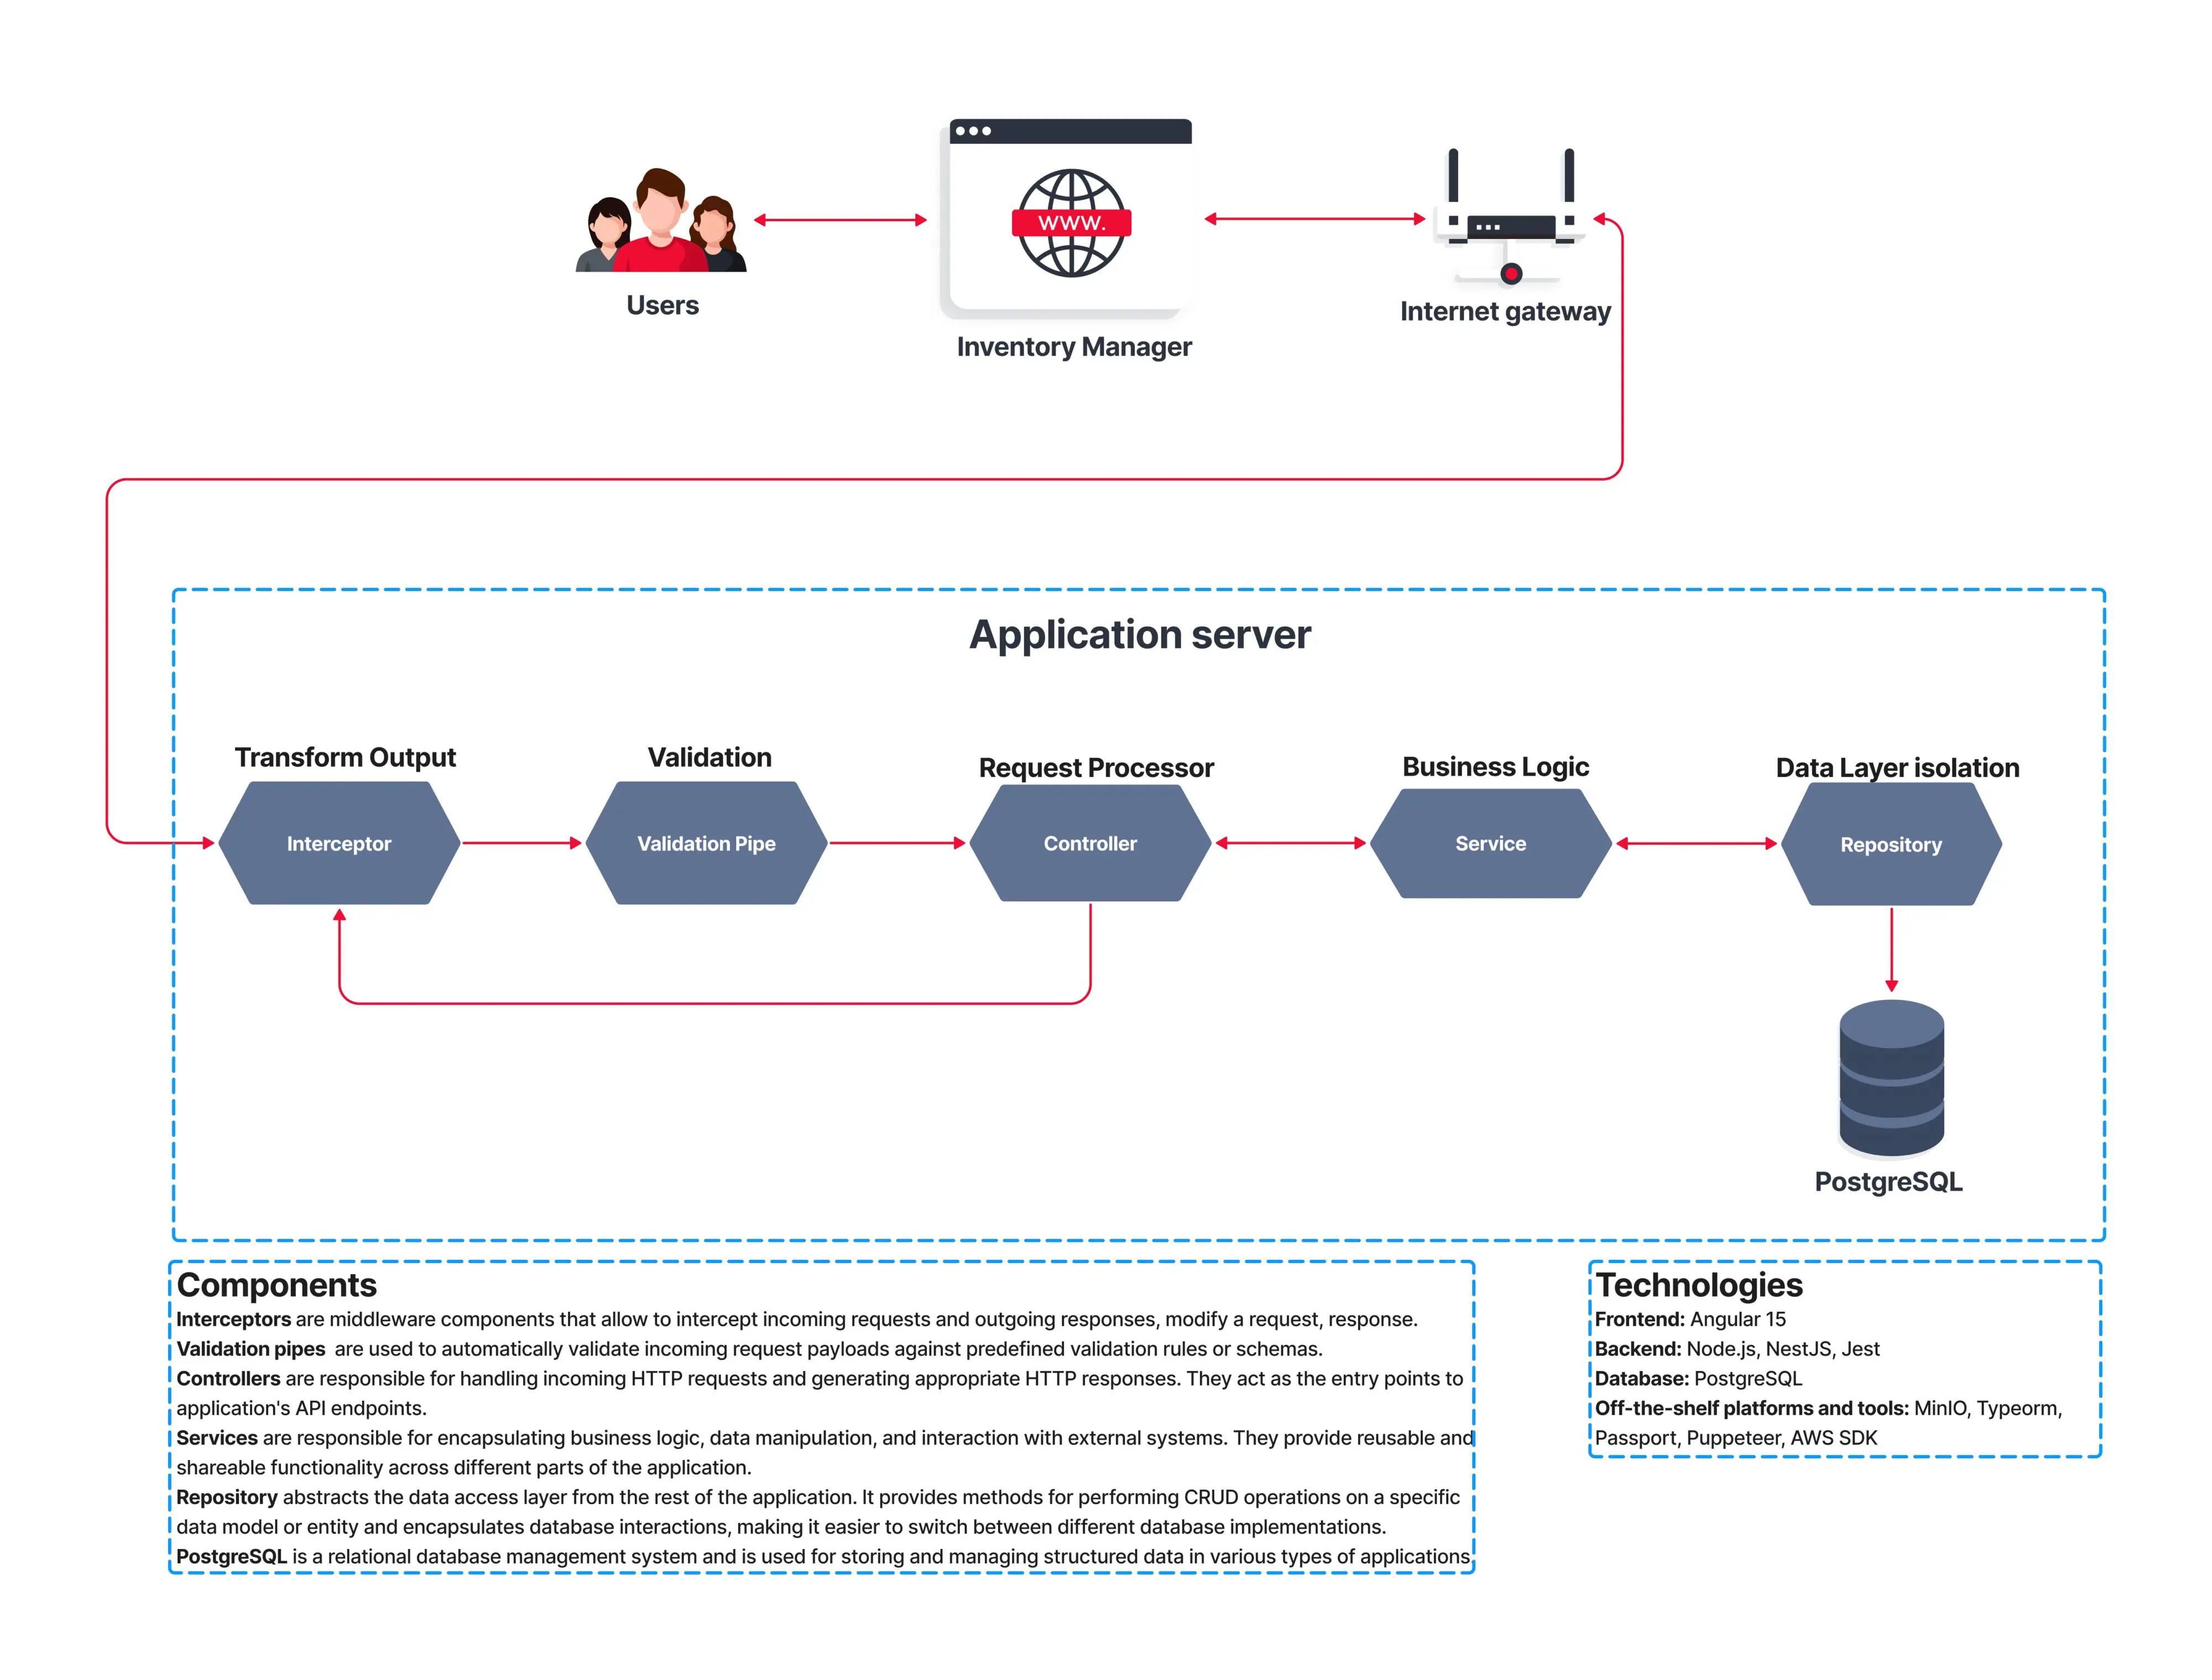
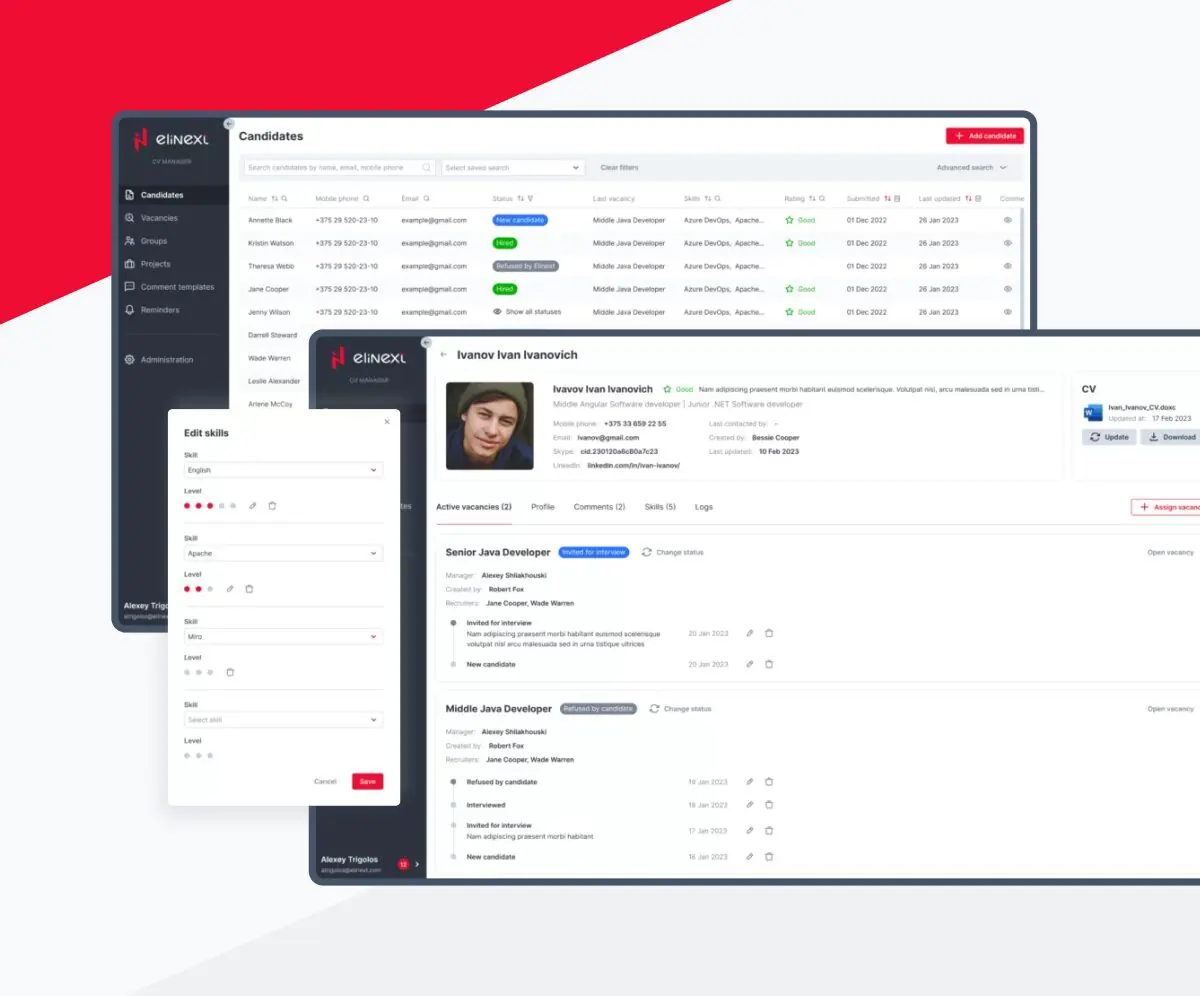
“We built a gateway add-on that shows hardware and virtual components side by side in real time, so a spike on a physical port and a slowdown on a virtual switch read as the same event.
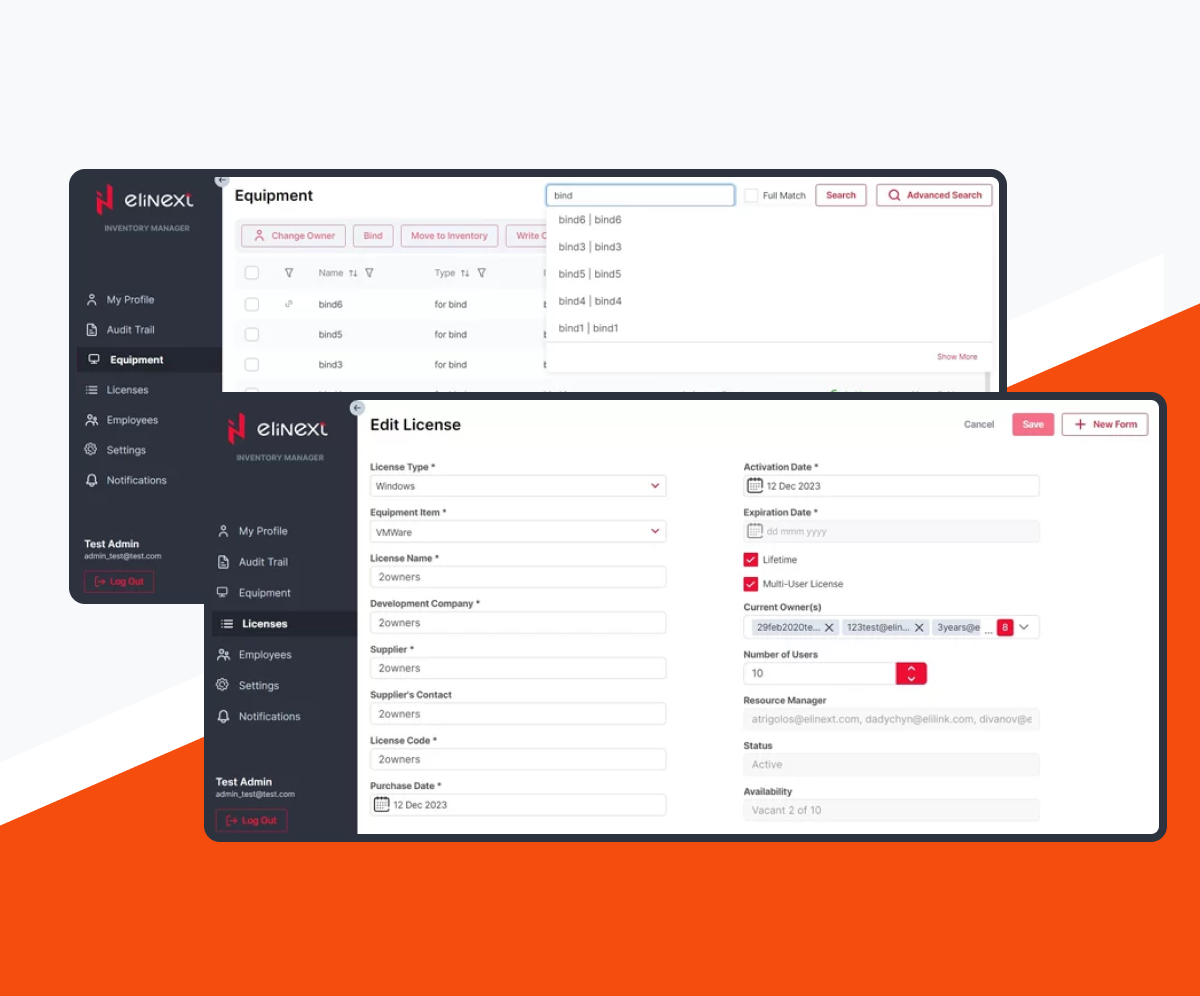
First, we pulled metrics straight from switch chips over REST APIs and wrote custom converters for new switch types the original system couldn’t parse.
Second, we added virtual switch monitoring for NSX-T, which maps overlay traffic back to the physical hardware carrying it.
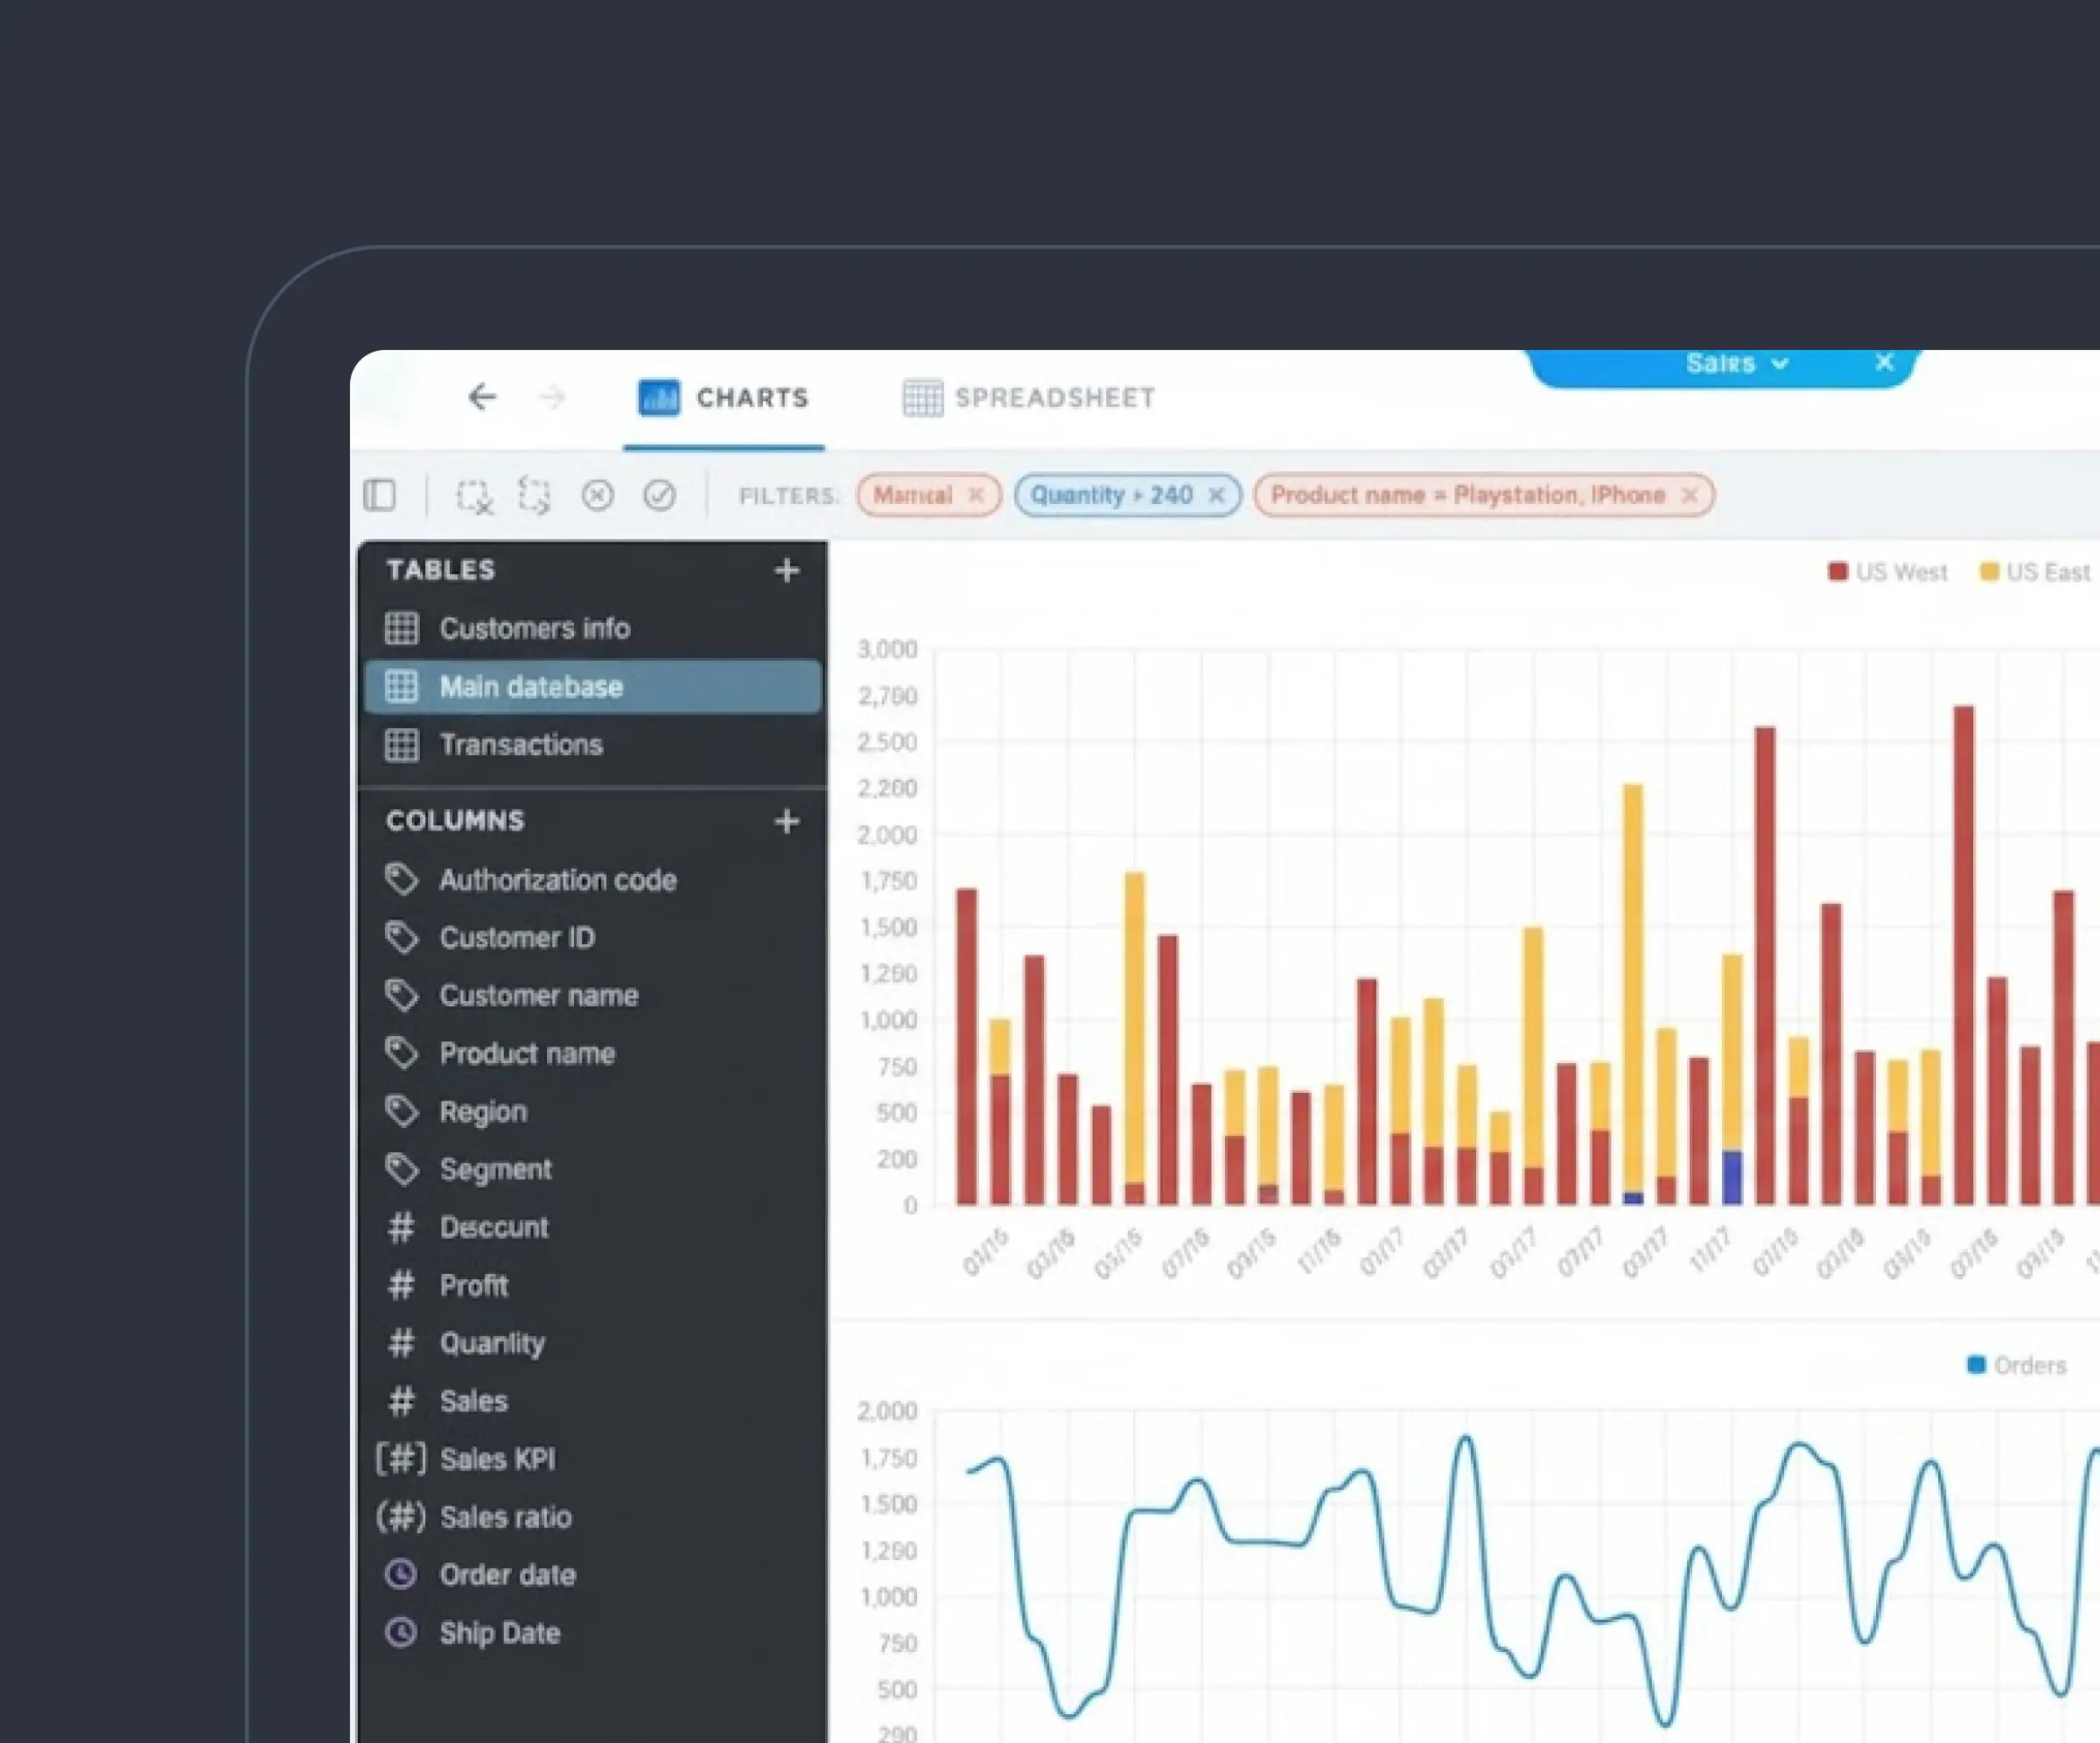
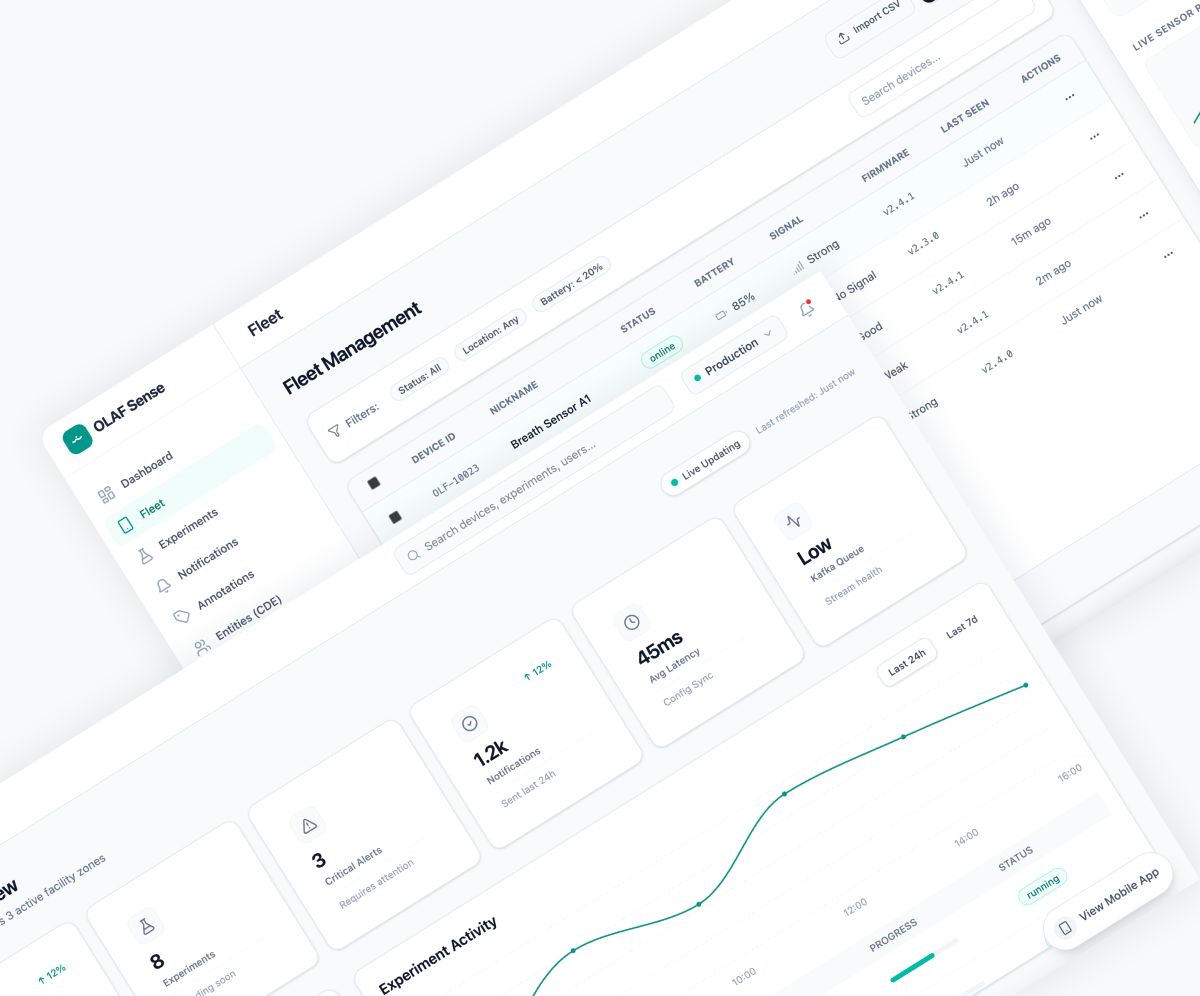
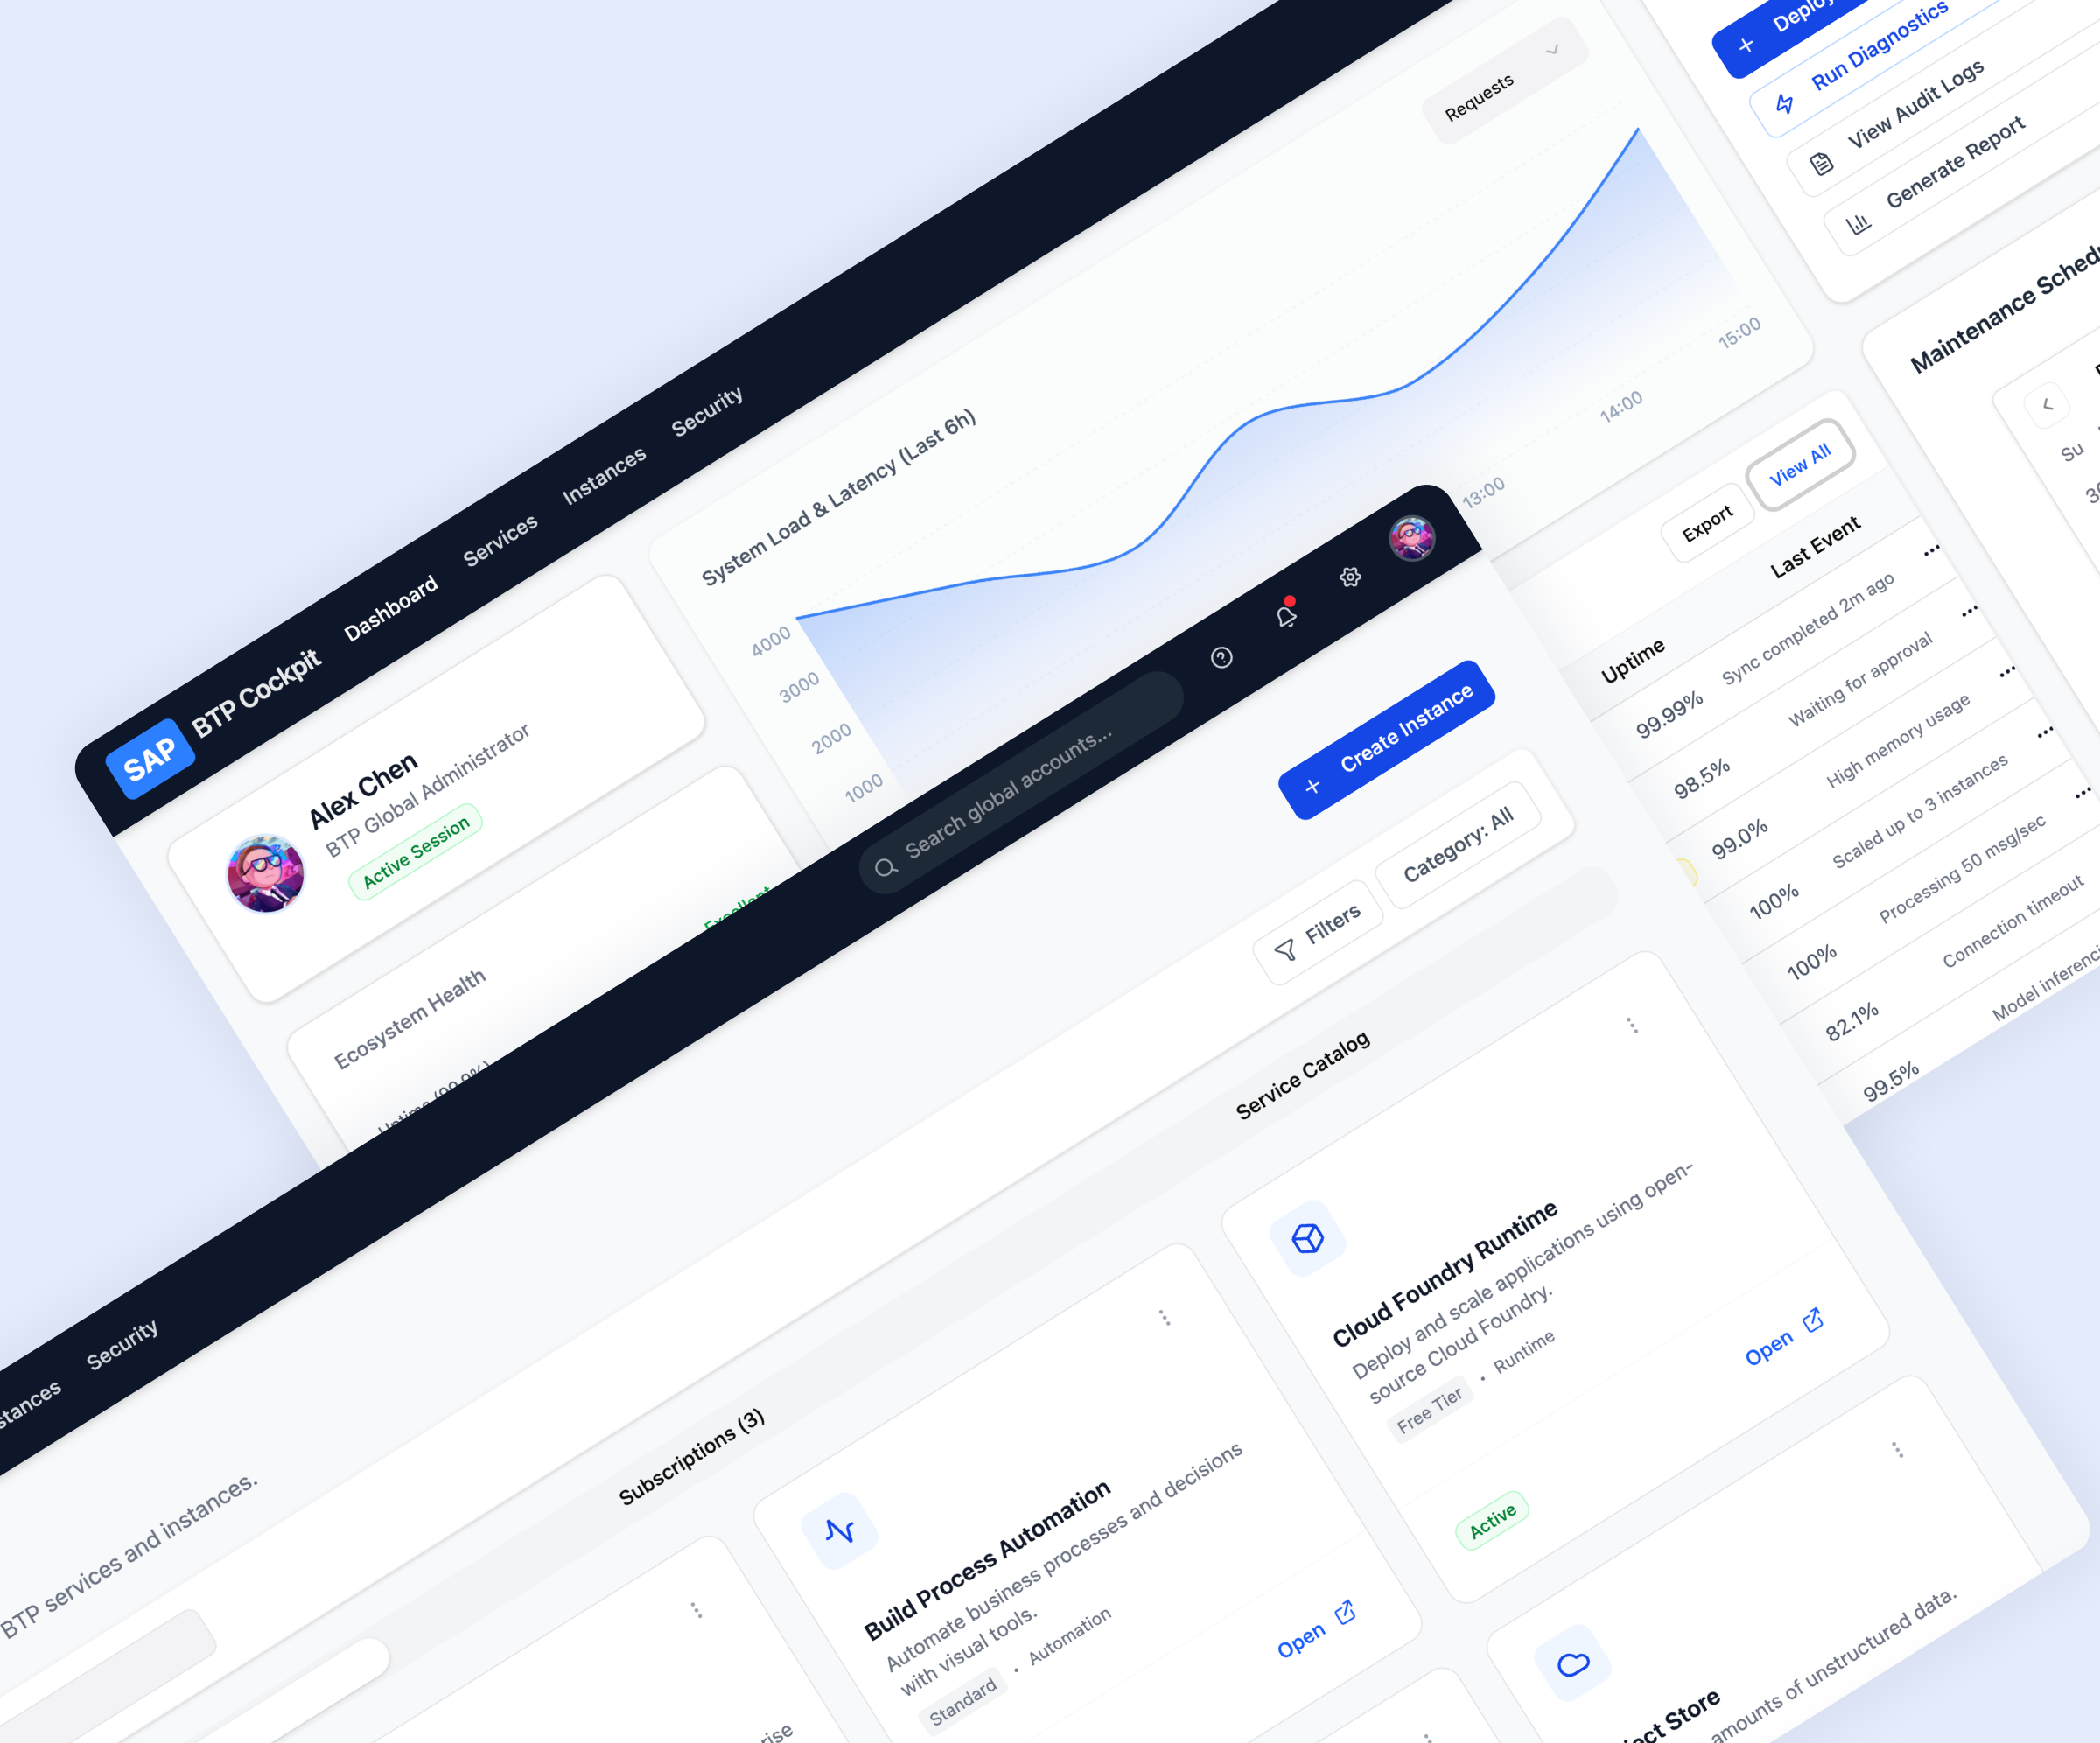
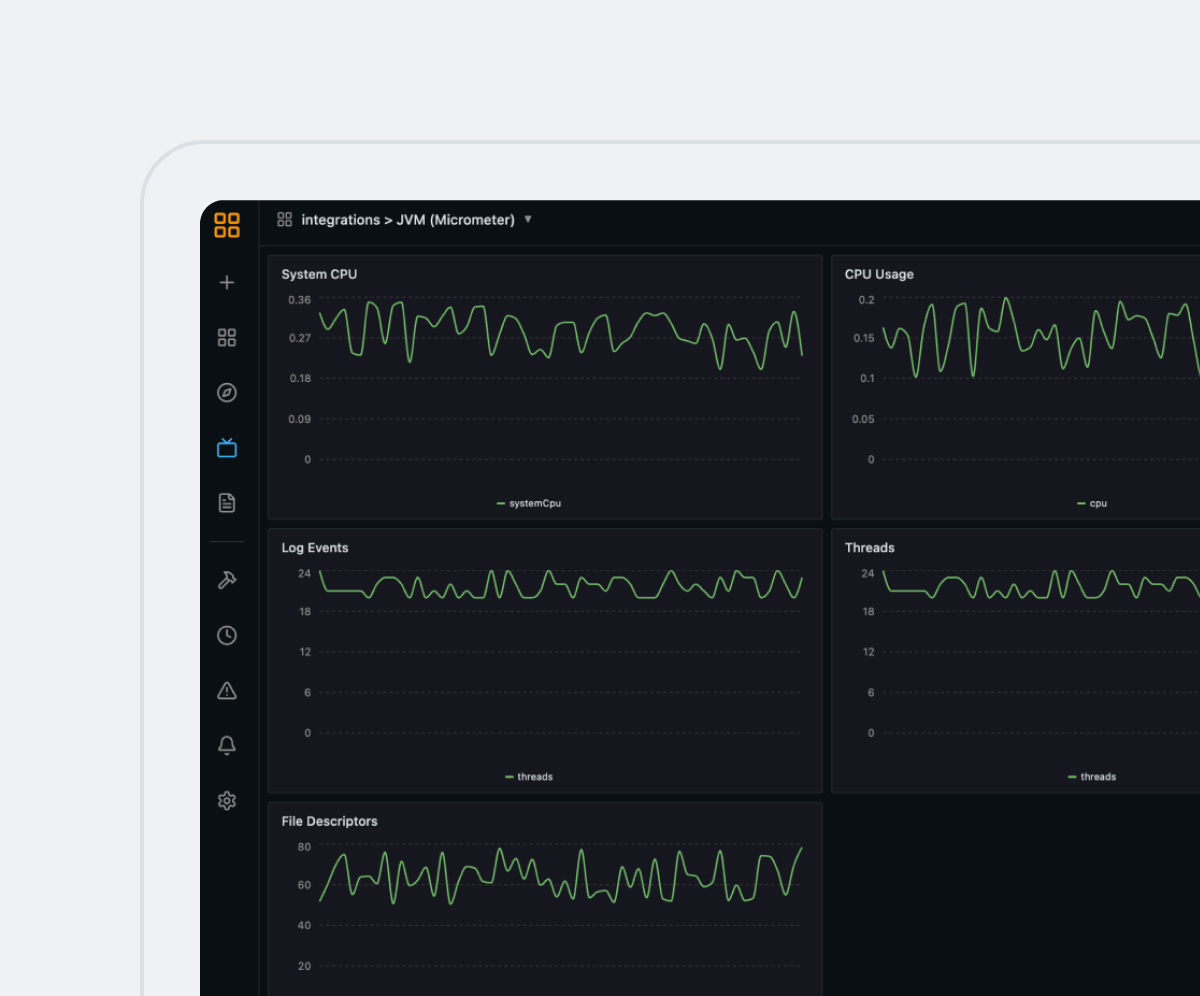
Third, a web interface with hundreds of metrics and charts turned raw counters into something an engineer can act on at 2 a.m. That’s the difference between real solutions and nice-looking graphs. It’s telecom analytics working at the layer where faults actually begin.”
What Changed: From Reactive Tickets to Minutes, Not Days
What changed for the operators using it?
“I’ll be careful here. The case doesn’t come with a tidy MTTR percentage, and I’m not going to make one up. What changed is the workflow. Before, an engineer would see an alarm on the virtual layer, open a ticket, and wait while the hardware team dug through a separate tool. Days get lost in that handoff. Now the same engineer follows the symptom down to the physical switch without leaving the session.
A lot of hard engineering made that possible: data transformation and parallel processing algorithms, a migration to Vertica because datasets outgrew standard storage, integrations with about 15 third-party products, and a simulator so we could test monitoring logic without touching a live network. That’s data analytics in telecom built for operations, not for slide decks. Here, telecom analytics simply means you find the problem before your subscribers do.”

Hybrid networks are hard to watch because faults start in hardware and show up in software, and legacy tools only see one side. We connected both: chip-level data over REST, NSX-T virtual switch monitoring, and a shared interface. The business effect is simple. Engineers stop debating whose layer it is and start fixing it, ideally before a customer reaches for the phone.

Key Takeaways
- Faults start in the underlay. In this case, most issues began on physical switch chips and only later hit virtual switches, VMs, and containers. If you only watch the overlay, you’re tracking symptoms. Root causes sit a layer lower, and that’s where your data collection has to reach.
- Correlation beats more dashboards. The gateway add-on didn’t add another screen. It merged two existing views into one timeline. Most of the value of analytics in the telecom industry comes from linking events across layers, not from piling up more charts nobody has time to read.
- Legacy data is still usable. The team worked with a huge codebase that had very little documentation. They didn’t wait for a full rewrite. They wrote custom converters for incompatible switch types and refactored the UI and architecture step by step, keeping the platform live for operators the whole time.
- Scale is an engineering problem first. Datasets grew past what standard storage could handle, which led to a Vertica migration and parallel processing algorithms. Skip that groundwork and data analytics in telecom turns into a nightly report instead of a live signal engineers can act on.
- Test without risking the live network. A dedicated monitoring simulator and automated integration tests let the team validate new logic away from production. Telecom analytics solutions that can’t be tested safely end up being ones nobody trusts during a real incident at 3 a.m.
Conclusion
Here’s my take. Most operators don’t have a data shortage. They have a context shortage. Switch chips report plenty, NSX-T reports plenty, and nobody puts the two together until a customer complains. This project wasn’t won with a clever algorithm. It was won by connecting physical and virtual layers so the cause and the symptom show up together.
It also took patience: a dozen years, more than 70 developers and 19 QA specialists across five teams, plus a legacy stack nobody would design from scratch today. That’s what analytics in the telecom industry looks like in practice. It’s messy, step by step, and very concrete. If you’re moving from reactive monitoring to analytics, start with the gap between your layers. Better charts can wait.
Explore telecommunication software development services from Elinext.
FAQ
-
It means collecting and correlating data from network hardware, virtual functions and services so teams can spot trends, predict faults, and act quickly. In the Elinext case, that meant combining switch-chip metrics with NSX-T virtual switch data.
-
They watch the underlay. Many faults start on physical switch chips before they affect virtual switches and services. Real-time collection over REST APIs, linked to the overlay, shows problems while they’re still invisible to subscribers.
-
They speak different languages. Physical switches expose chip-level counters, while SDN platforms like VMware NSX-T describe virtual switches and VMs. Legacy tools usually handle one side, so teams end up with two views and slow handoffs.
-
Switch performance counters, port and traffic statistics, virtual switch metrics, and VM and container telemetry. Good data analytics in telecom combines these into one timeline so an early hardware signal can be tied to the service it will hurt.
-
No. The platform in this case serves thousands of operators of very different sizes. Smaller teams often benefit more, since they can’t keep separate hardware and virtualization specialists watching every alarm around the clock.
-
It depends on your starting point. Adding a monitoring module to a modern stack can take months. Modernizing a large legacy platform, like in this case, is a long, phased effort that delivers value at each step.
-
Monitoring tells you something is red. Analytics tells you why, where, and what breaks next. Telecom analytics solutions correlate events across physical and virtual layers instead of just raising separate alarms per device.