

One of the most important aspects of software development is performance optimization. In a highly competitive digital landscape, even minor improvements in performance can lead to significant gains in user satisfaction and system efficiency.
Java Microbenchmark Harness (JMH) is becoming a powerful tool in the Java ecosystem, offering developers a robust framework for microbenchmarking and fine-tuning their applications. In this article, we’ll delve into advanced techniques for performance analysis using JMH.
Understanding JMH
Before diving into advanced performance analysis, let’s recap the basics of JMH. JMH is a Java library specifically designed for testing Java code, and is commonly used in Java development services to optimize performance. It provides a standardized way to measure the performance of Java code snippets under various conditions. JMH eliminates many common pitfalls encountered during benchmarking, such as warm-up iterations, result averaging, and statistical analysis, ensuring accurate and reliable performance measurements.
JMH Advantages
Java Microbenchmark Harness (JMH) offers several advantages for Java developers when it comes to benchmarking and performance analysis. Let’s dive into some of the key advantages of using JMH:
- Accurate and Reliable Results: JMH eliminates common pitfalls encountered during benchmarking, such as warm-up iterations, result averaging, and statistical analysis. This ensures that test results are accurate, reliable, and free from common sources of measurement error.
- Standardized Benchmarking: JMH provides a standardized framework for benchmarking Java code, making it easy to write, execute, and analyze benchmarks consistently across different projects. This standardization simplifies the process of performance analysis and allows developers to focus on optimizing their code.
- Integration with Build Systems: JMH can be integrated with build systems such as Maven and Gradle, allowing developers to incorporate performance testing into existing development workflows. This enables automated benchmarking as part of the continuous integration (CI) pipeline, ensuring that performance remains a priority throughout the development lifecycle.
- Fine-Grained Control: JMH offers fine-grained control over benchmarking parameters, allowing developers to customize the benchmarking process according to their specific requirements. This includes configuring the number of warm-up iterations, measurement iterations, and the number of parallel forks, which provides flexibility to adapt tests to different use cases.
- Statistical Analysis: JMH provides built-in support for statistical analysis of test results, including metrics such as mean, standard deviation, and confidence intervals. This statistical analysis allows developers to evaluate the reliability and consistency of performance measurements, helping to identify outliers and anomalous results.
- Profiling Support: JMH integrates seamlessly with profiling tools such as Java Flight Recorder (JFR) and Java Mission Control (JMC), allowing developers to profile the execution of benchmarked code. Profiling provides detailed analysis of CPU usage, memory allocation, and execution time of methods, helping to identify performance bottlenecks and areas for optimization.
- Community Support and Documentation: JMH benefits from an active community of users and contributors, providing access to a wealth of resources, tutorials, and documentation. Community support makes it easy for developers to get started with JMH, troubleshoot problems, and share best practices for benchmarking and performance analysis.
- Cross-Platform Compatibility: JMH is designed to work seamlessly across different Java platforms and environments, including desktop, server, and embedded systems. This cross-platform compatibility ensures that test results are consistent across different runtimes, making it easier to compare and analyze performance across different configurations.
Setting Up JMH
To get started with JMH, you need to add the necessary dependencies to your project. If you’re using Maven, you can include JMH by adding the following dependencies to your `pom.xml`:
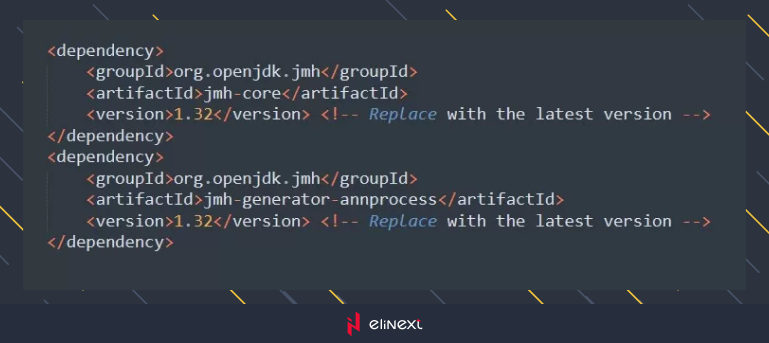
Make sure to replace the version numbers with the latest available versions of JMH.
Writing Microbenchmarks
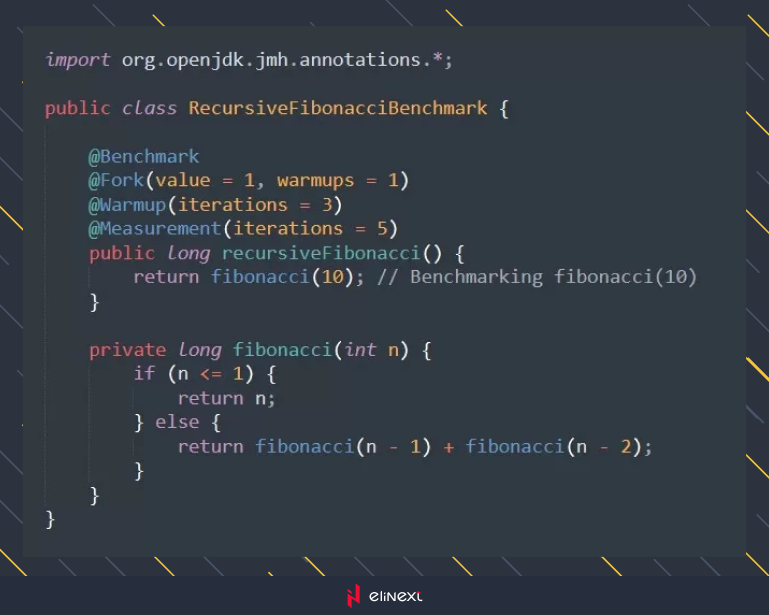
Let’s delve into some code examples to demonstrate how you can use JMH to benchmark Java code. We’ll start with a simple example that compares the performance of two different methods for finding the nth Fibonacci number: the recursive and iterative approaches.
Recursive Fibonacci Benchmark
Iterative Fibonacci Benchmark
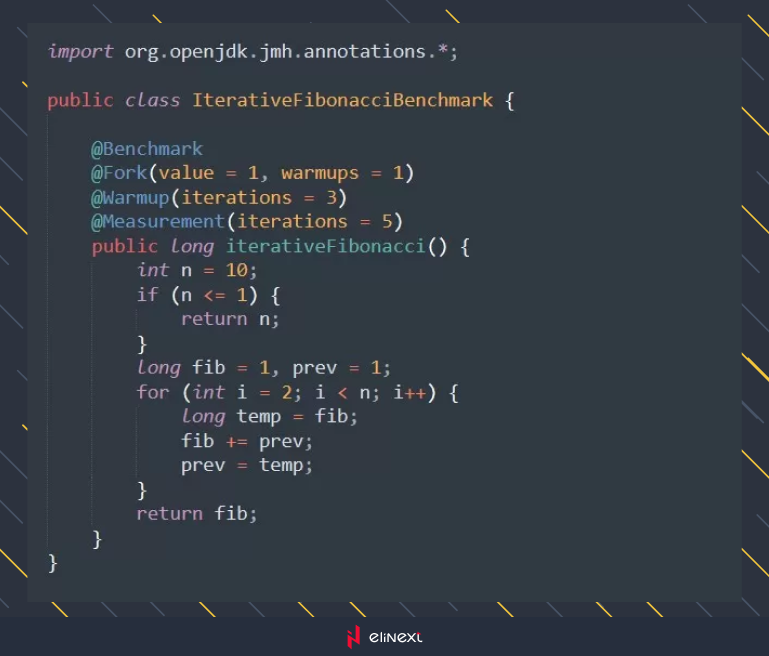
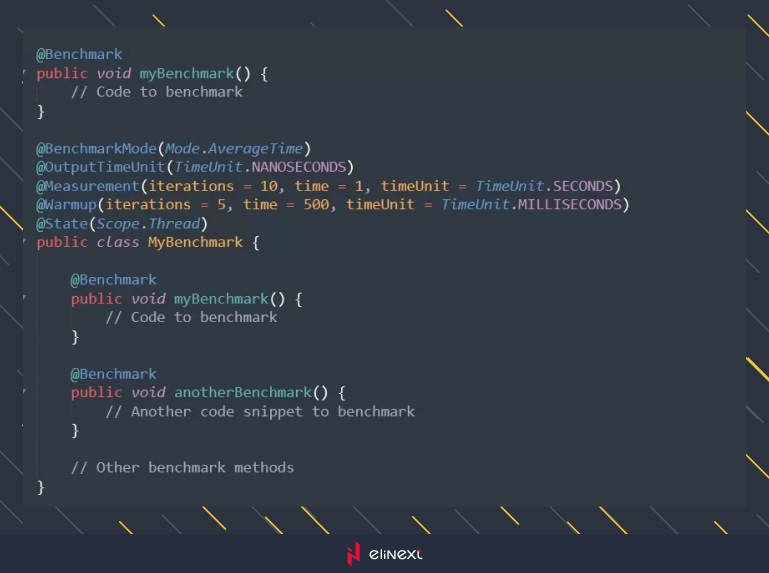
In these examples, we’ve defined two benchmark classes, each containing a method annotated with `@Benchmark`, representing the piece of code to be tested. We’ve also included annotations such as `@Fork`, `@Warmup`, and `@Measurement` to configure the benchmarking parameters.
Running Benchmarks
Once we’ve written the benchmark classes, we can execute them using the JMH command-line runner or by integrating JMH with our build system. For simplicity, let’s focus on running benchmarks using the command-line runner.
To run the benchmarks from the command line, navigate to the directory containing your benchmark classes and execute the following command:
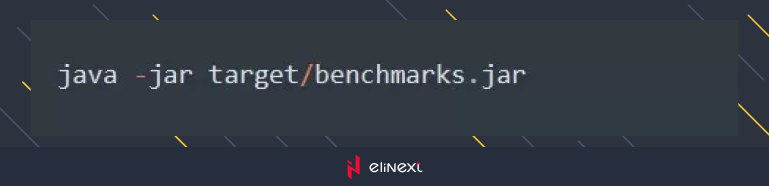
This command will compile your benchmark classes and run the tests, generating a report with detailed performance metrics.
Analyzing Benchmark Results
Once the benchmarks have been executed, JMH generates comprehensive reports containing various metrics such as throughput, average execution time, and standard deviation. Let’s look at some best practices for analyzing test results.
-
Statistical Analysis
JMH provides statistical analysis capabilities to help you make informed decisions based on benchmark results. By default, JMH calculates statistical metrics such as mean, standard deviation, and confidence intervals for benchmarked code snippets. Understanding these metrics enables you to evaluate the reliability and consistency of performance metrics.
Example:
-
Profiling
Profiling with JMH involves collecting detailed runtime information about the code’s execution, including CPU usage, memory allocation, and method call times. Profiling helps identify performance bottlenecks and areas for optimization.
Example:
Optimization Techniques
Once performance bottlenecks are identified, various optimization techniques can be applied to improve code efficiency. These may include algorithmic optimizations, data structure adjustments, or code refactoring.
Now let’s dive deeper into advanced performance analysis with JMH by providing more complex code examples demonstrating statistical analysis, profiling, and optimization techniques.
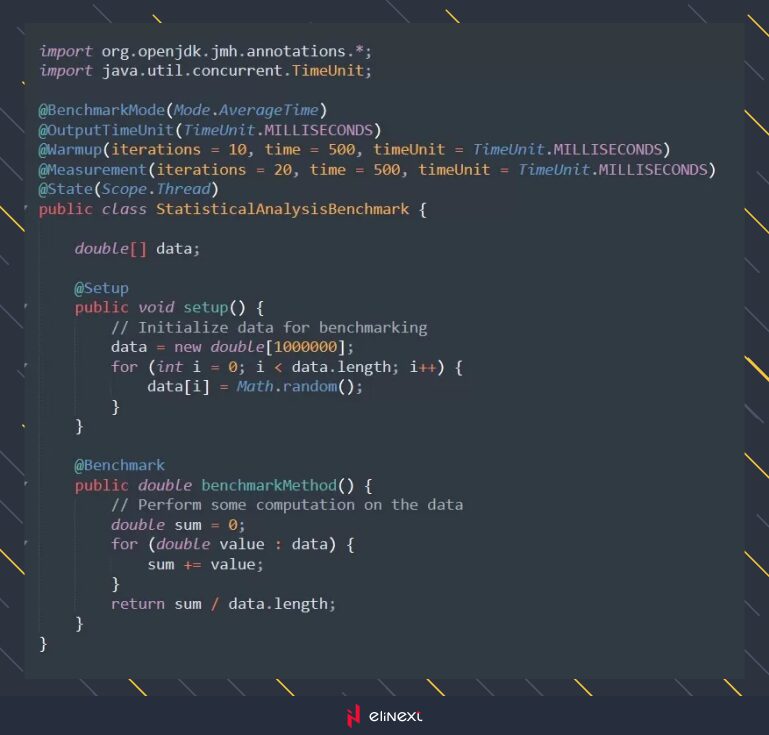
Statistical Analysis Example:
In this example, we use JMH annotations to set up a benchmark to perform statistical analysis. We measure the average time taken by the `benchmarkMethod()` over multiple warm-up and measurement iterations.
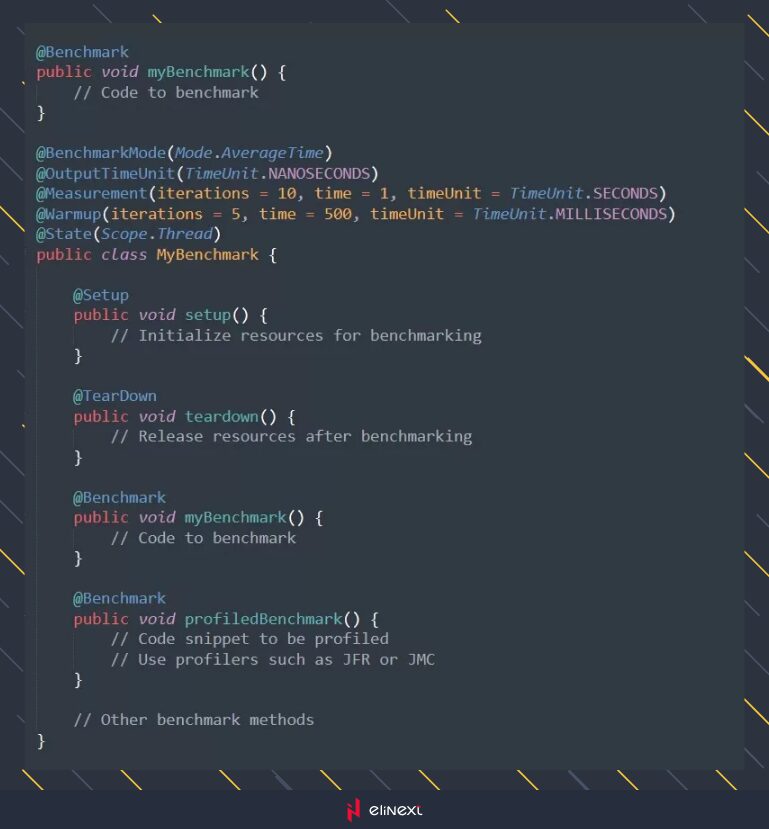
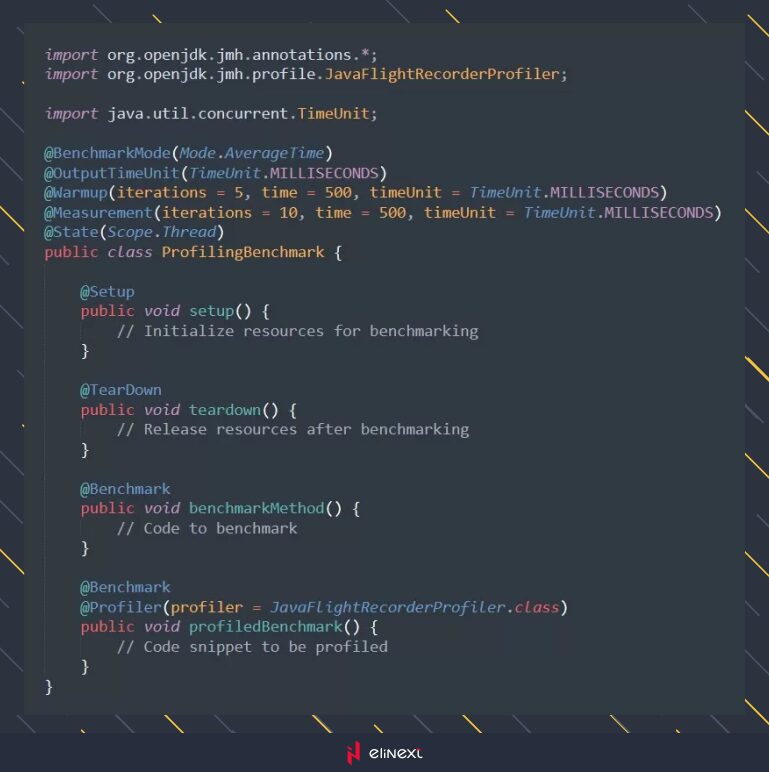
Profiling Example:
In this example, we useJMH annotations to configure the benchmark to use the Java Flight Recorder (JFR) profiler. The `profiledBenchmark()` method will be executed with profiling enabled, allowing us to collect detailed runtime information about its execution.
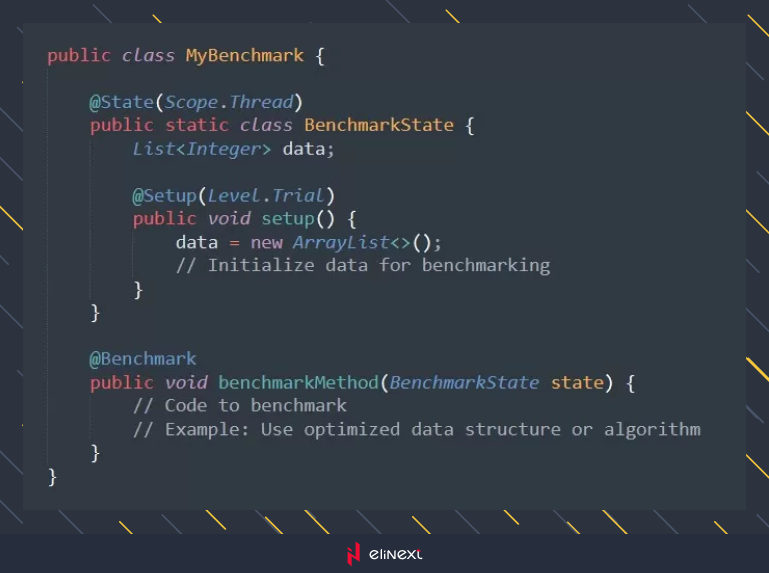
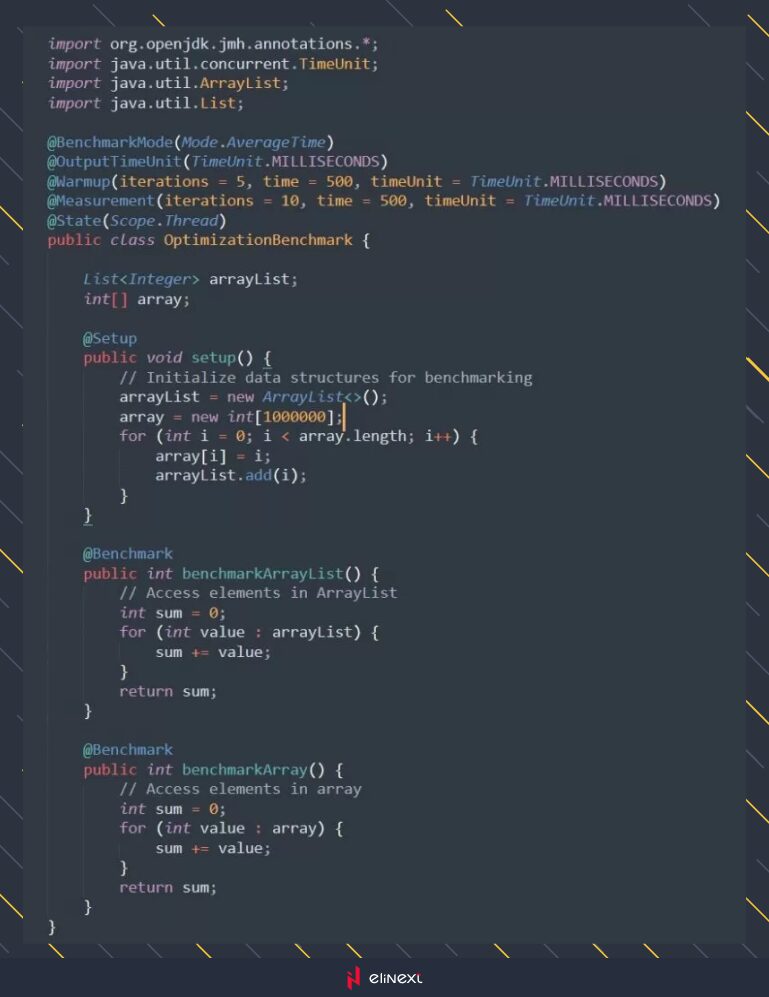
Optimization example:
In this example, we compare the performance of accessing elements in an ArrayList versus a simple array. This demonstrates an optimization technique where choosing the appropriate data structure can significantly impact performance.
Conclusion
Advanced performance analysis with JMH involves leveraging statistical analysis, profiling, and optimization techniques to uncover performance insights and improve code efficiency. By integrating these advanced strategies into your benchmarking workflow, you can identify and address performance bottlenecks, leading to faster and more efficient Java applications.
JMH provides a comprehensive framework for advanced performance analysis, empowering Java developers to optimize their code effectively and deliver high-performance applications in various domains and industries.
