

Unraveling the Secrets of Memory Leaks
Before diving into advanced detection techniques, let’s refresh our understanding of memory leaks. Memory leaks occur when objects are no longer needed by an application but remain in memory, thwarting the garbage collector’s attempts to free up space. Common culprits for memory leaks in Java include:
- Static Links: Objects held by static fields persist throughout the application’s lifecycle, potentially leading to memory bloat.
- Thread Local Variables: Objects stored in thread local variables might outlive their usefulness, occupying memory longer than necessary.
- Unclosed Resources: Failure to close resources like files, database connections, or streams can result in memory leaks.
- Listener Registration: Forgetting to deregister listeners can prevent objects from being garbage collected.
- Improper Caching: Caching objects indefinitely without proper expiration mechanisms can exacerbate memory leaks.
Let’s consider a practical example of a memory leak caused by improper resource management:
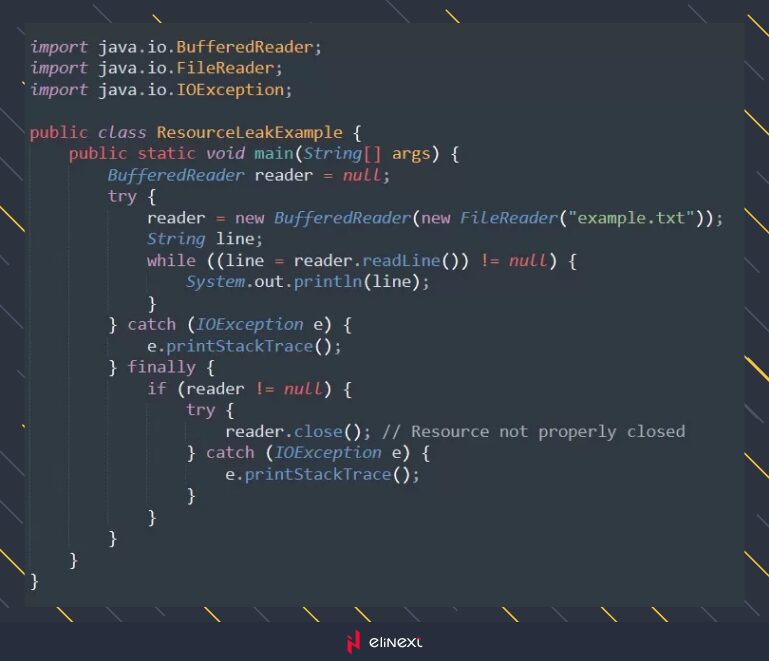
In this example, `the BufferedReader` resource is not properly closed in the `finally` block, potentially leading to a memory leak.
Advanced Detection Strategies
While basic memory profiling tools offer a good starting point, advanced detection strategies provide deeper insights into the root causes of memory leaks. Here are some advanced techniques to consider:
- Heap Dump Analysis: Heap dump analysis is a powerful technique for identifying memory leaks. Periodically taking heap dumps and analyzing them can unveil memory-hogging objects.
Tools like Eclipse Memory Analyzer (MAT) provide powerful visualization and analysis capabilities for heap dumps. Let’s see how we can analyze heap dumps using the Eclipse Memory Analyzer (MAT).
- Take a heap dump of the running Java application using the following JVM argument:

- Open the heap dump in MAT and analyze the retained heap to identify objects consuming excessive memory.
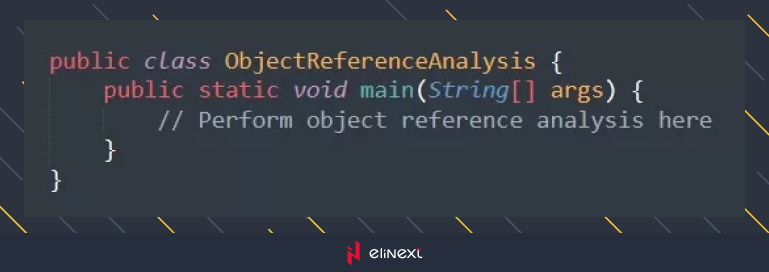
- Object Reference Analysis: Leveraging tools like YourKit or JProfiler can help pinpoint which objects are holding references to leaked objects, facilitating the identification of memory leak sources.
- Memory Leak Detection Libraries: Incorporating specialized libraries like LeakCanary for Android or jXray for Java applications can automate memory leak detection, streamlining the debugging process.
- Profiling Production Systems: Profiling memory usage in production environments using tools like Java Flight Recorder (JFR) or custom monitoring solutions can uncover memory leaks that manifest only under real-world usage scenarios.
Mitigation Techniques
Upon detecting a memory leak, swift mitigation is crucial to prevent further degradation. Consider the following mitigation strategies:
- Code Defect Resolution: Identify and rectify code defects responsible for memory leaks, such as unclosed resources or flawed caching mechanisms. Let’s fix the resource leak issue in our example:
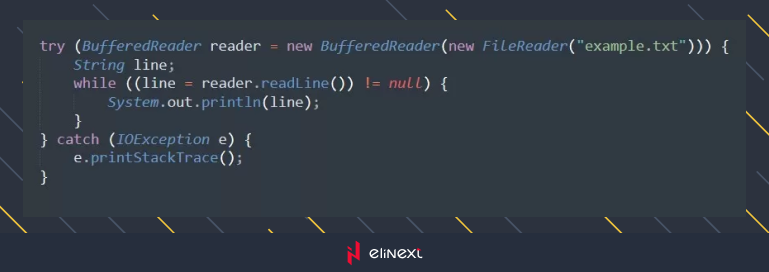
By using the try-with-resources statement, the `BufferedReader` resource is automatically closed after use, preventing resource leaks.
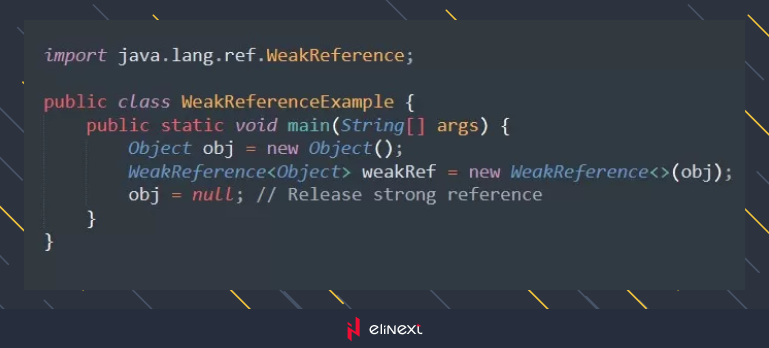
- Using Weak References: Weak references can help prevent memory leaks by allowing objects to be garbage collected when no longer needed:
- Resource Management Practices: Ensure robust resource management by diligently closing resources using try-with-resources blocks or finally blocks to stave off resource leaks.
- Optimizing Data Structures: Optimize data structures and algorithms to minimize memory usage and enhance performance.
- Continuous Testing and Monitoring: Integrate automated tests, profiling tools, and monitoring solutions into your development workflow to regularly test and monitor applications for memory leaks, thereby catching issues early on.
Conclusion
Memory leaks pose significant challenges to Java application developers, but with the right tools and strategies, they can be effectively managed. By leveraging advanced detection techniques such as heap dump analysis, object reference analysis, and memory leak detection libraries, developers can pinpoint and address memory leaks more efficiently.
Mitigation strategies like resolving code defects, employing weak references, and optimizing resource management practices are essential for maintaining application robustness and stability. Let’s incorporate these techniques into our development practices to build Java applications that are resilient to memory leaks, ensuring a smooth user experience.
