


Data Visualization Services
Data Visualization Services by Elinext

Partnering directly with clients, our seasoned, time-zone-aligned tech professionals having 7-12 years of expertise consult, build, implement, optimize and maintain your software solutions to help you ensure your data visualization is clear and meaningful.

Whether you want to build tailored data visualization software or need to customize a ready-made solution, we can provide a piece of advice on matters like a best-suited toolkit, step-by-step software development and implementation and cost optimization strategy.

Get in touch with our experts for any queries or assistance required as you implement your new data visualization solutions. From setup and configuration to testing, end-user training, and ongoing support, we ensure seamless adoption and maximum performance for everyone who needs it.

Optimize your systems confidently with a mature data visualization solutions company by your side. Improve the source code, add advanced features, enhance the overall speed or migrate seamlessly to the cloud by using the services of an IT provider with 20+ relevant projects under its belt.

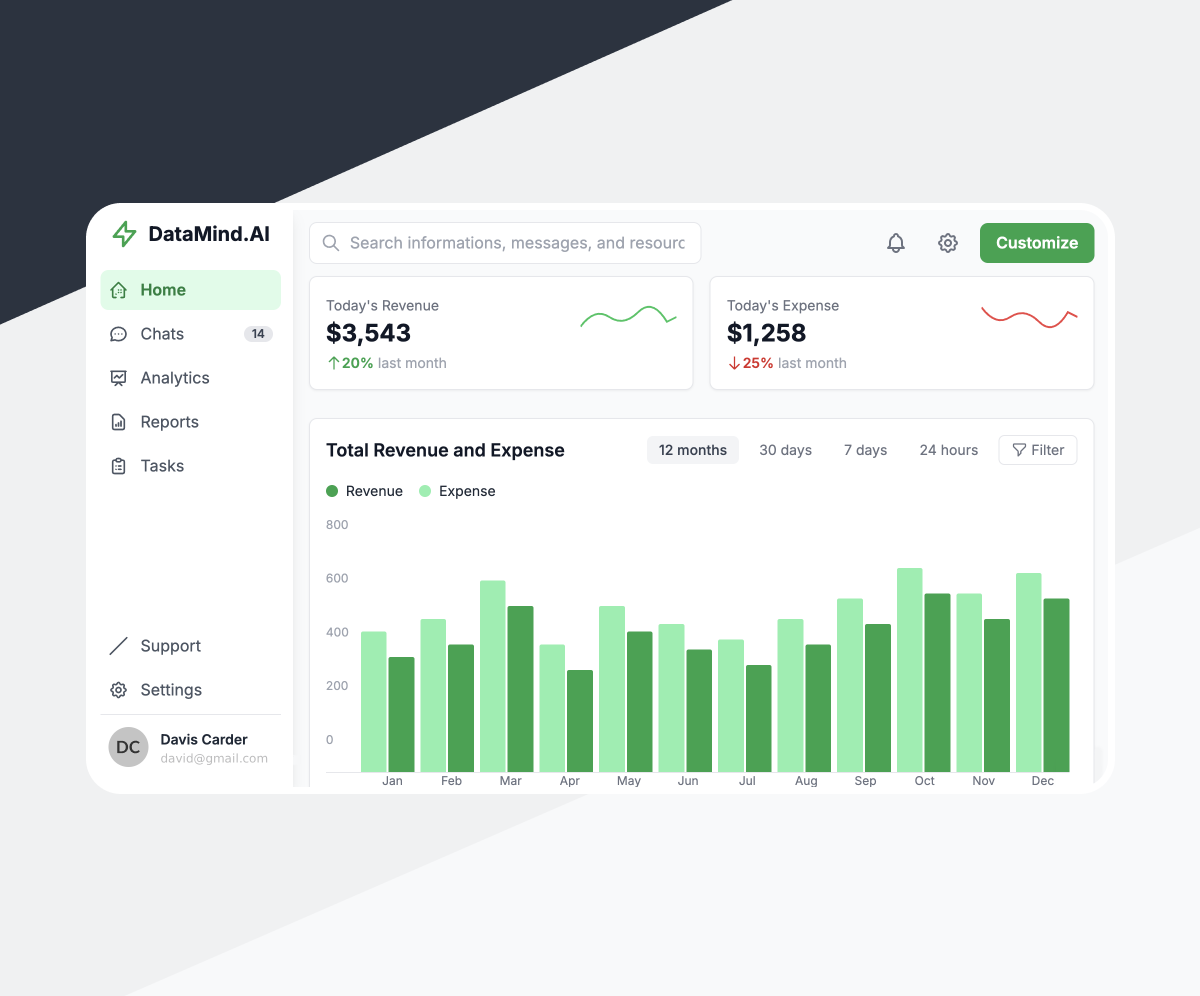
Delegate your project to a reputable data visualization solutions company and enjoy the headache-free development of a modern platform that will aggregate, clean, transform, and analyze your organization’s data helping surface useful insights.

Struggling with standard reports that do not reflect the reality of your business? Let us help. At Elinext, we create complex custom reports by merging multi-source data, automate endless, error-prone copy-pasting and cut report generation time from days to minutes.

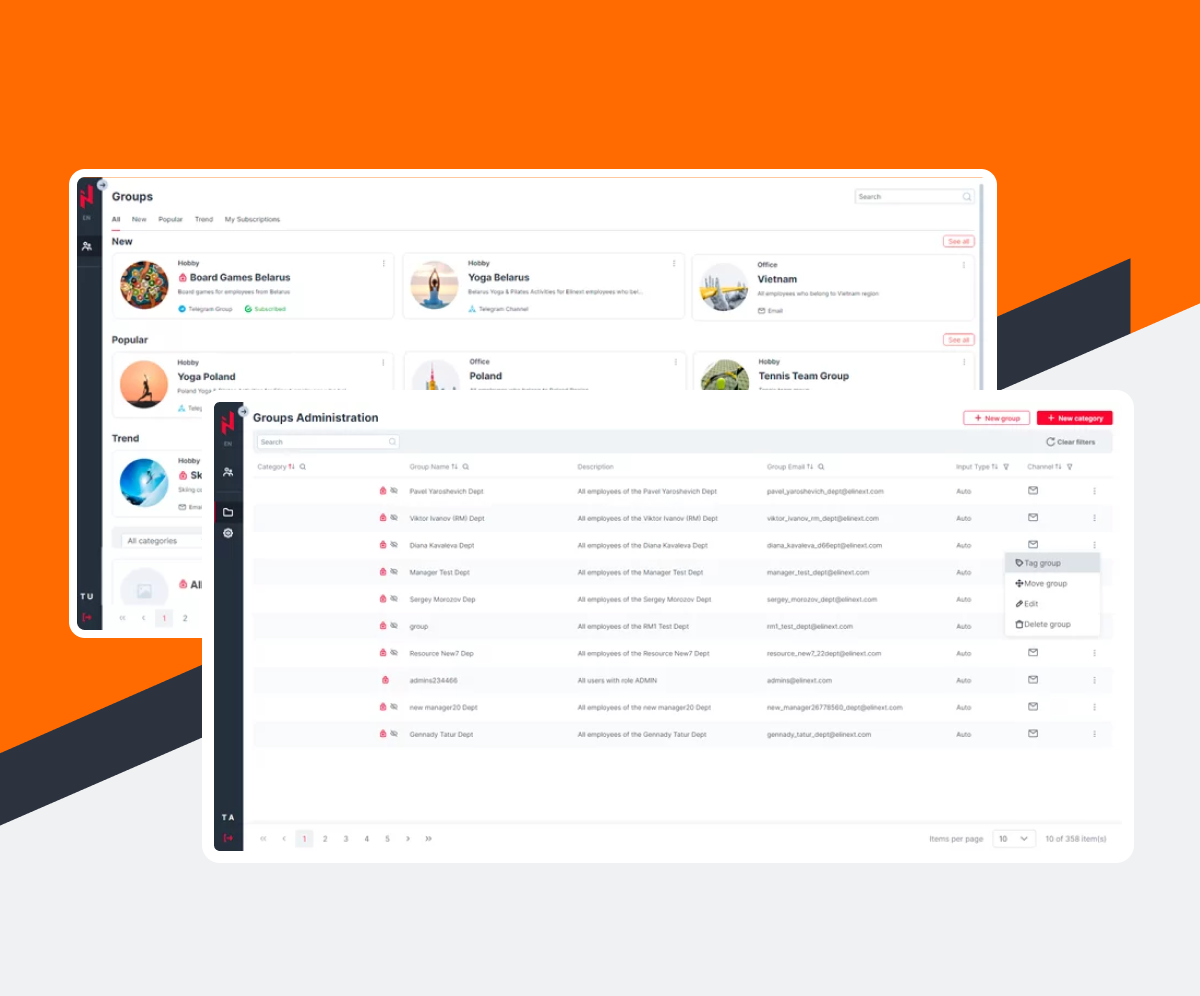
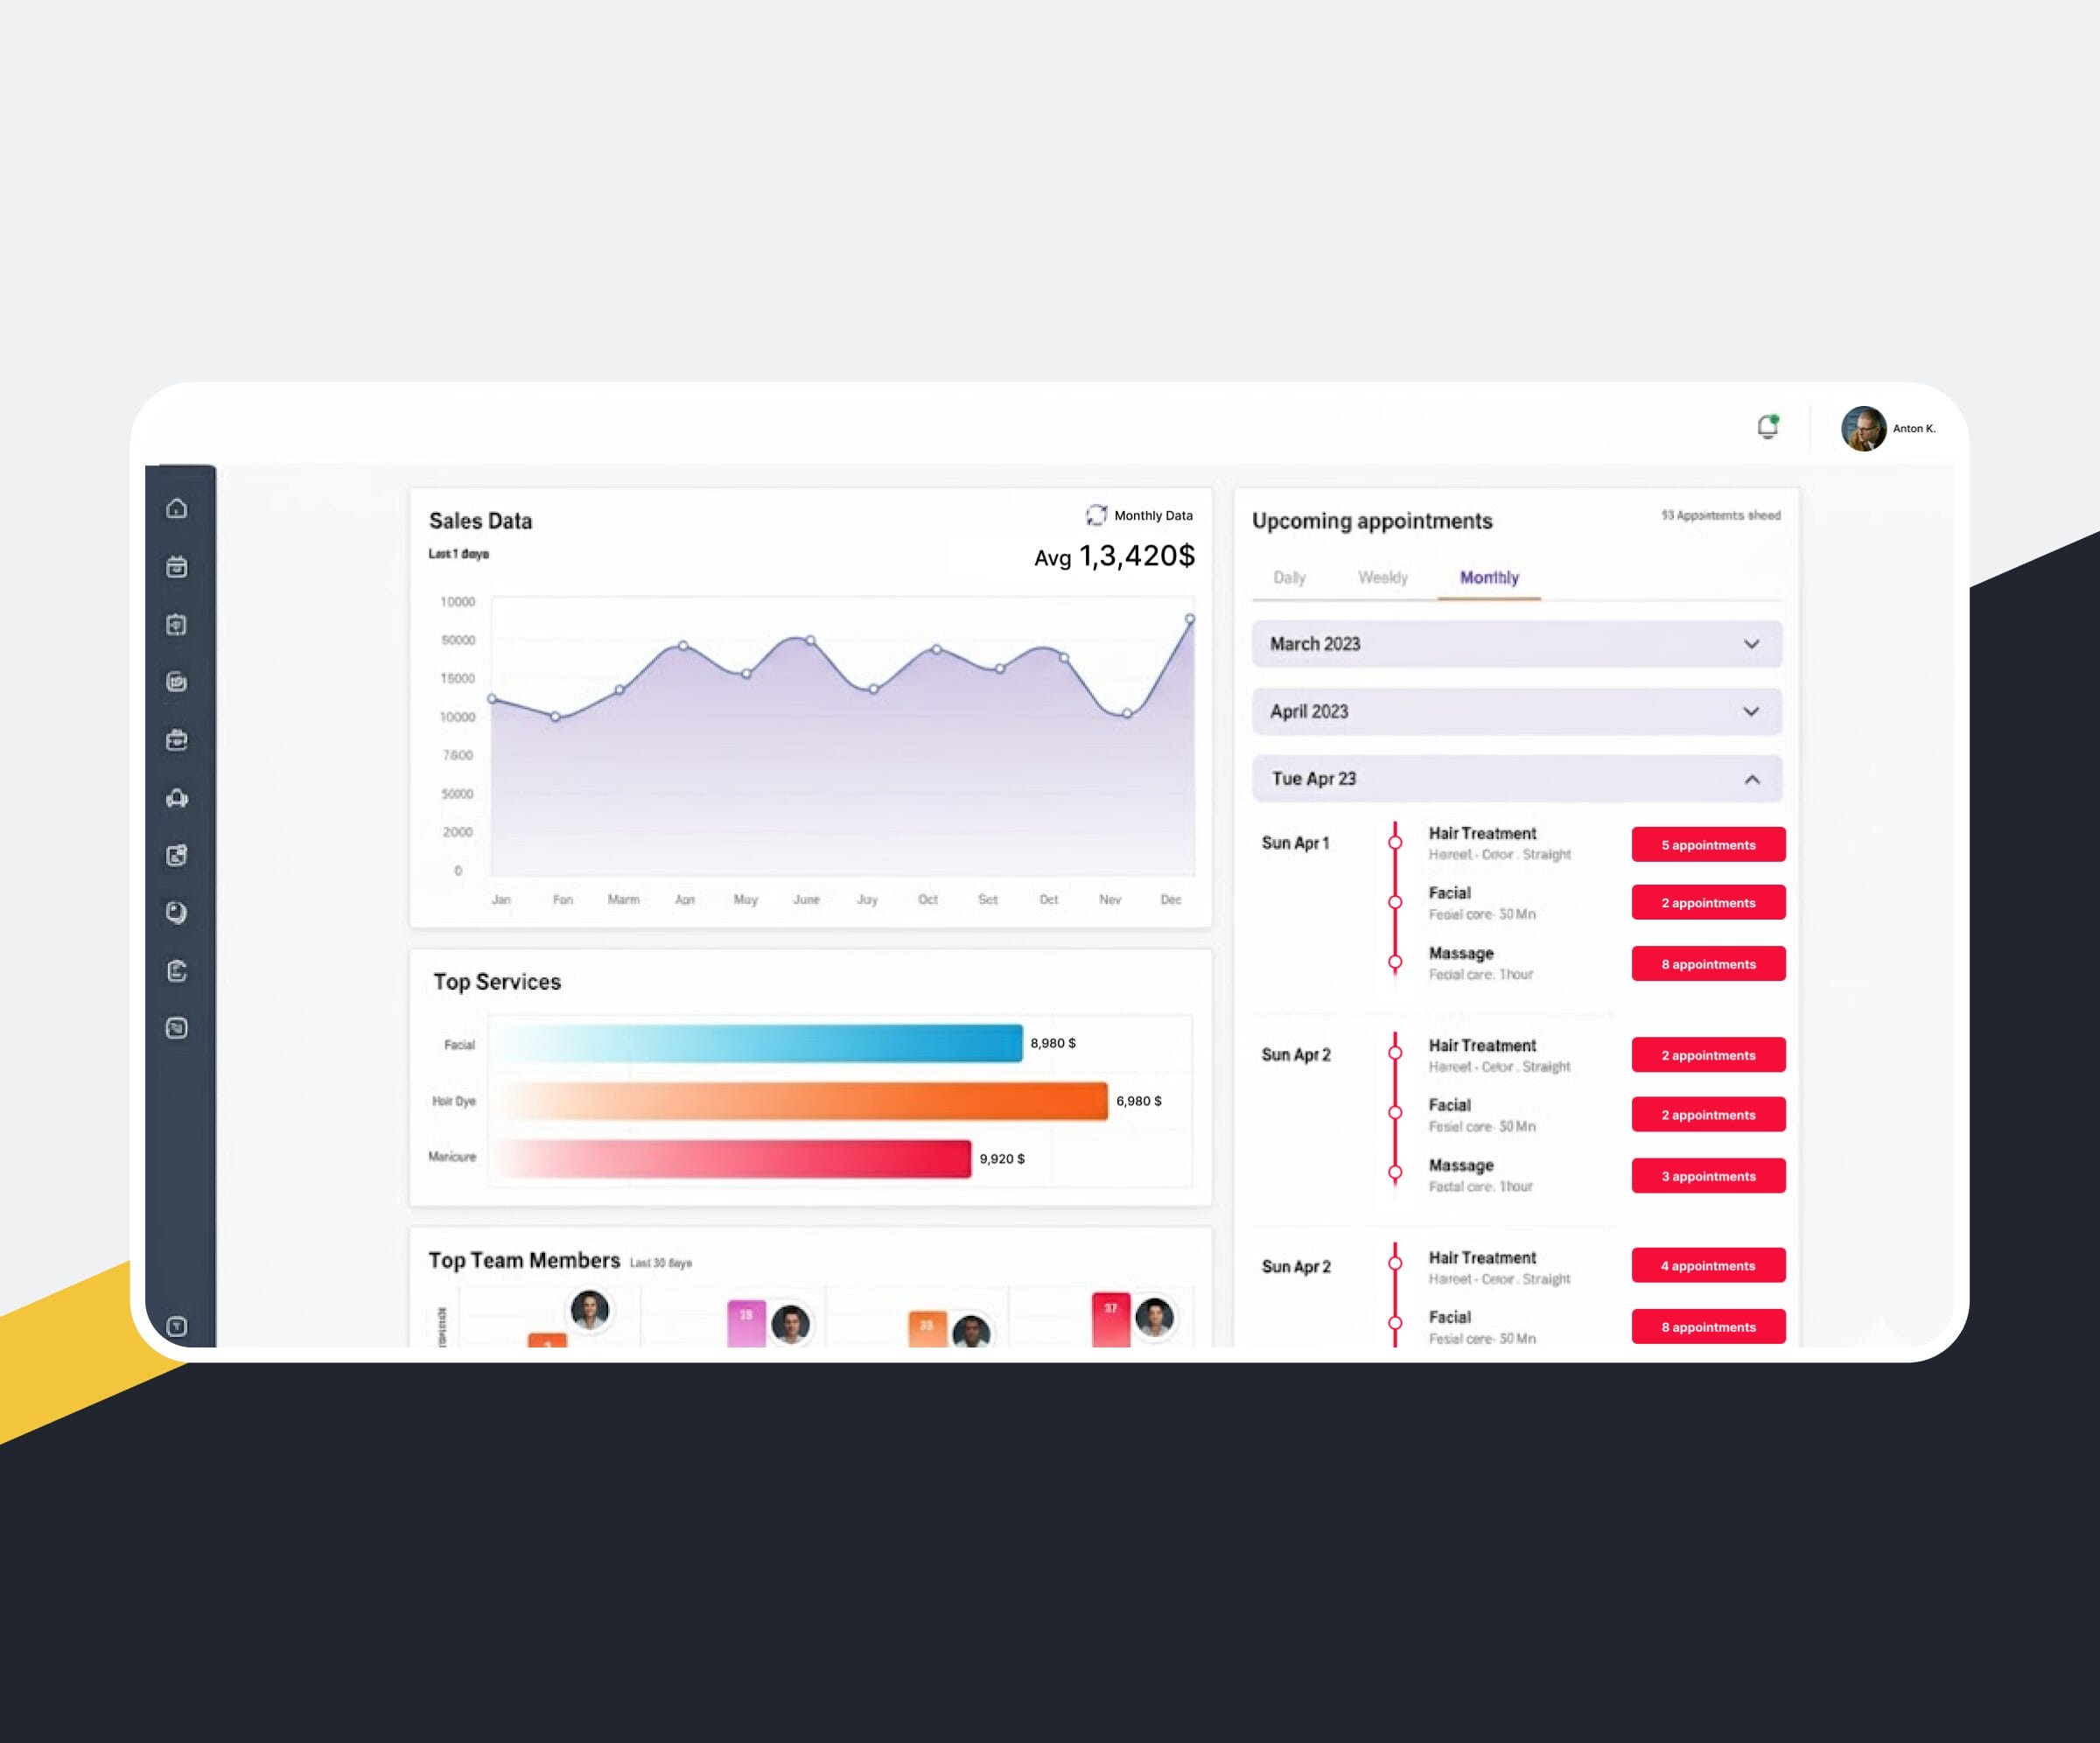
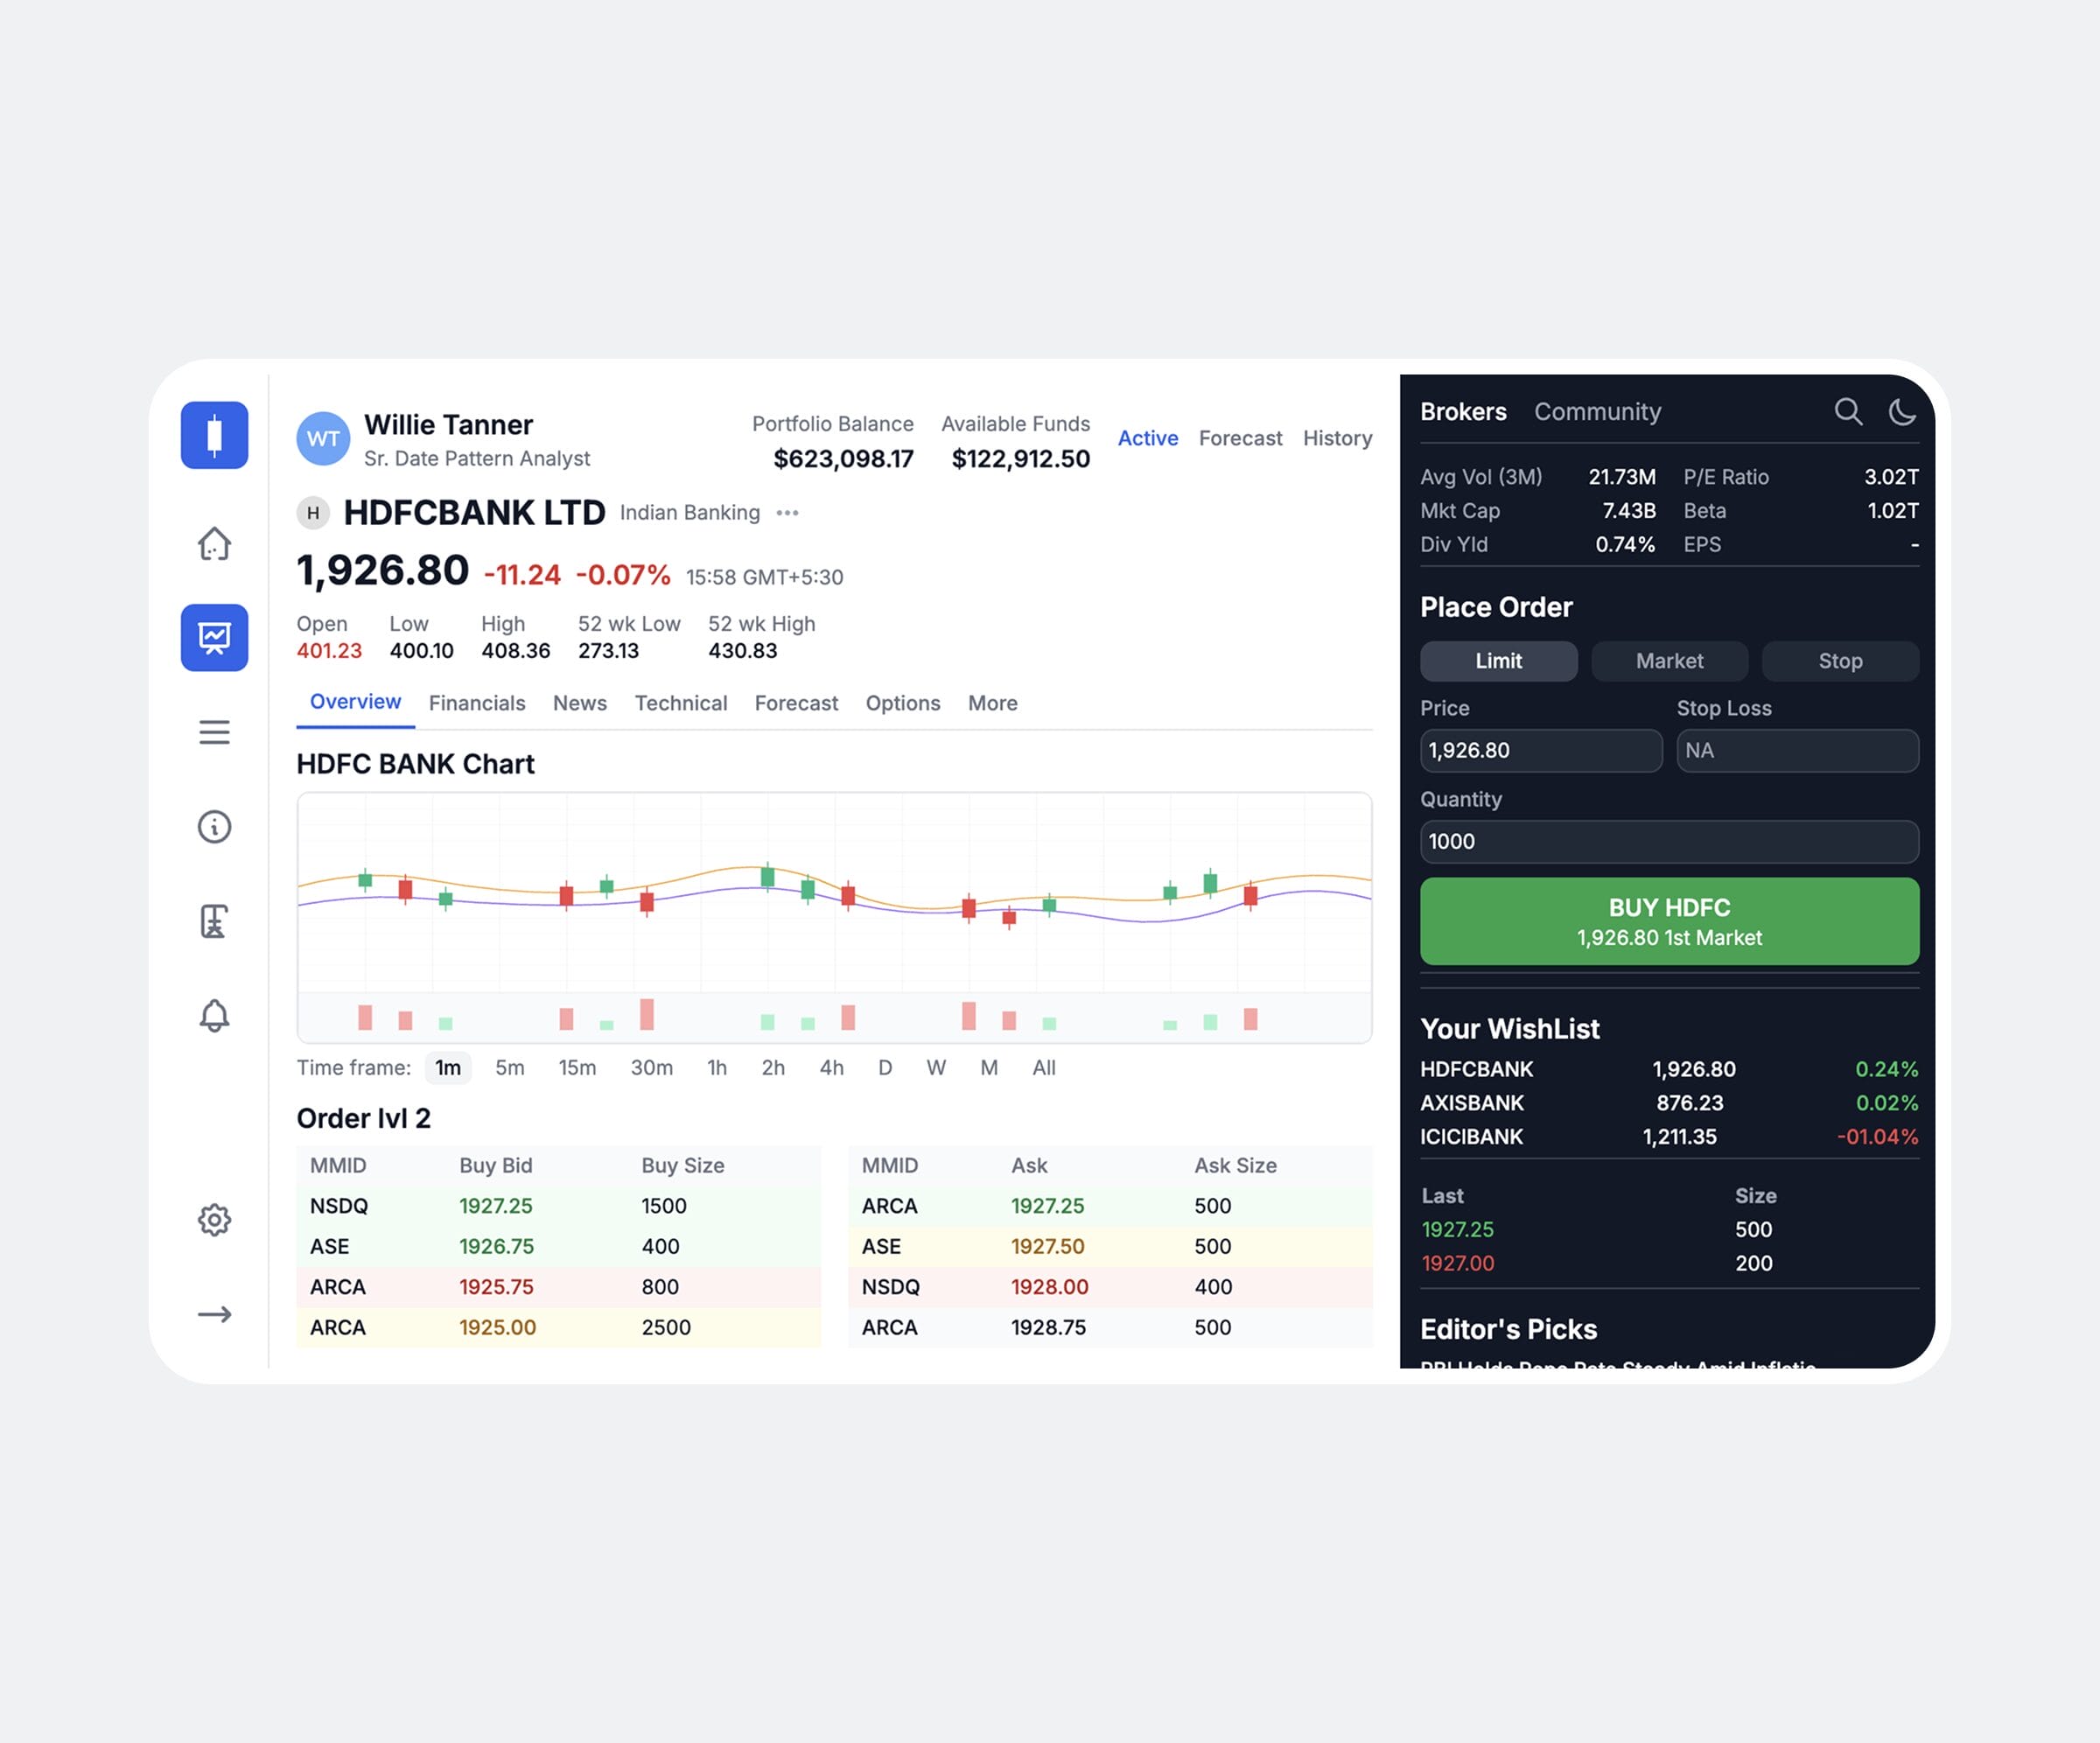
Entrust the development of BI data visualization solutions to the IT vendor with 28+ years of relevant expertise. Operating across industries, we build BI dashboards and reports that morph raw business data into visually interactive insights that help users at all levels.

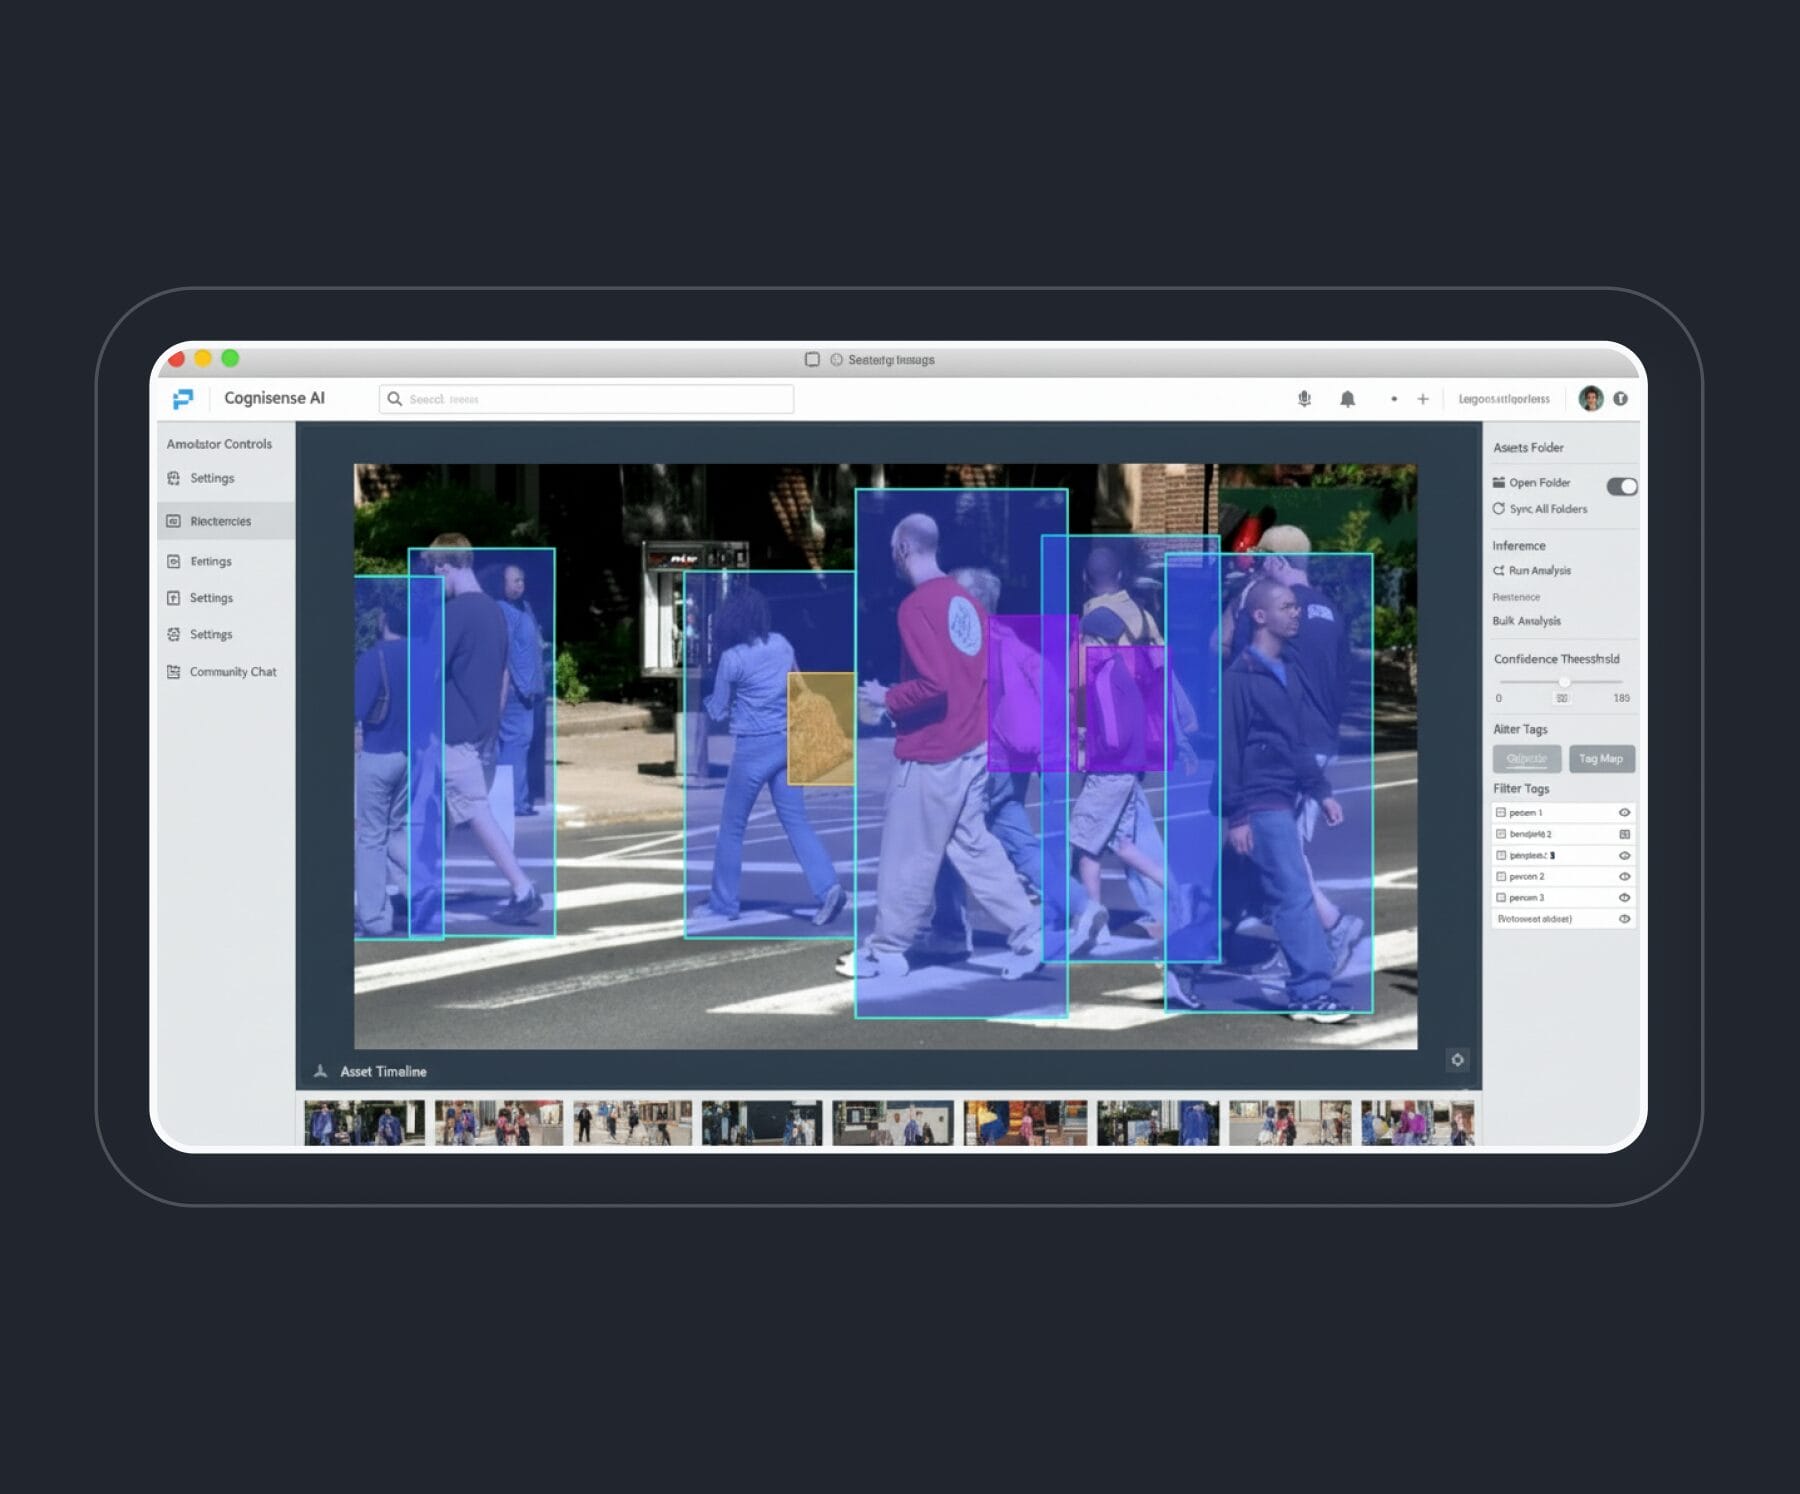
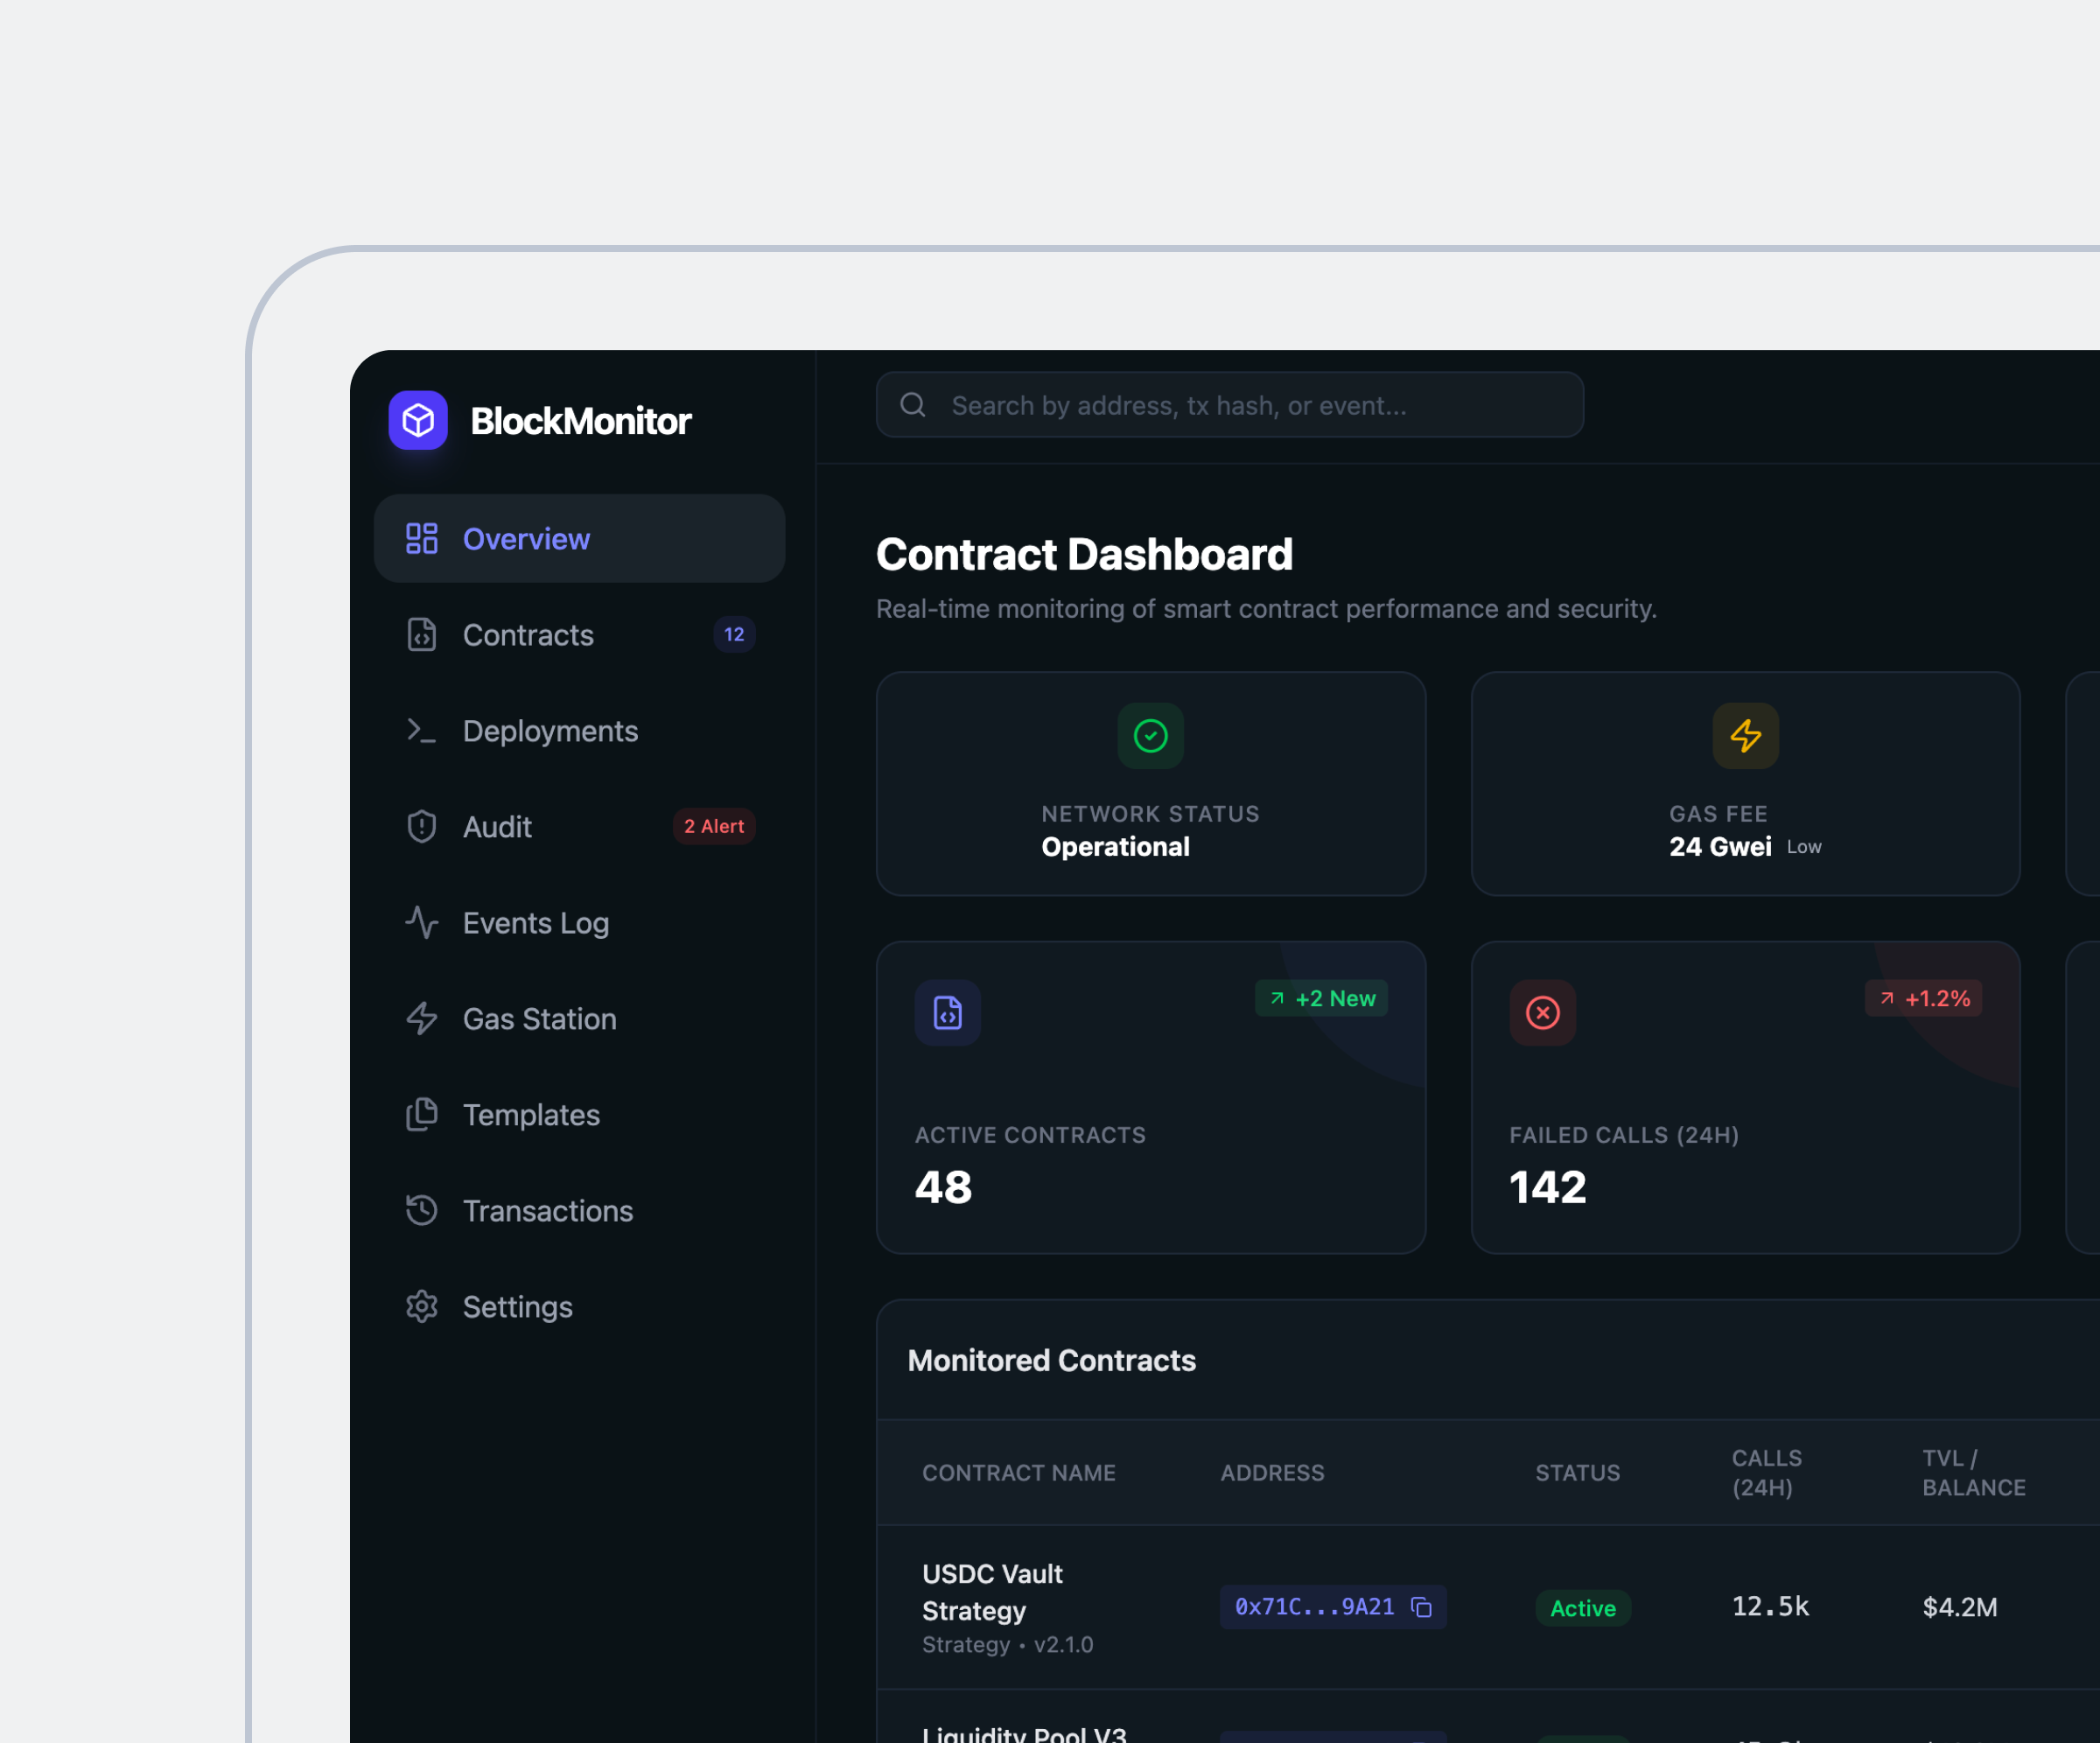
Hire data visualization services from a company boasting 20+ successfully delivered Big Data projects. Use Big Data solutions to see trends, identify risks, update existing products/services and innovate while the hired handles all technicalities.

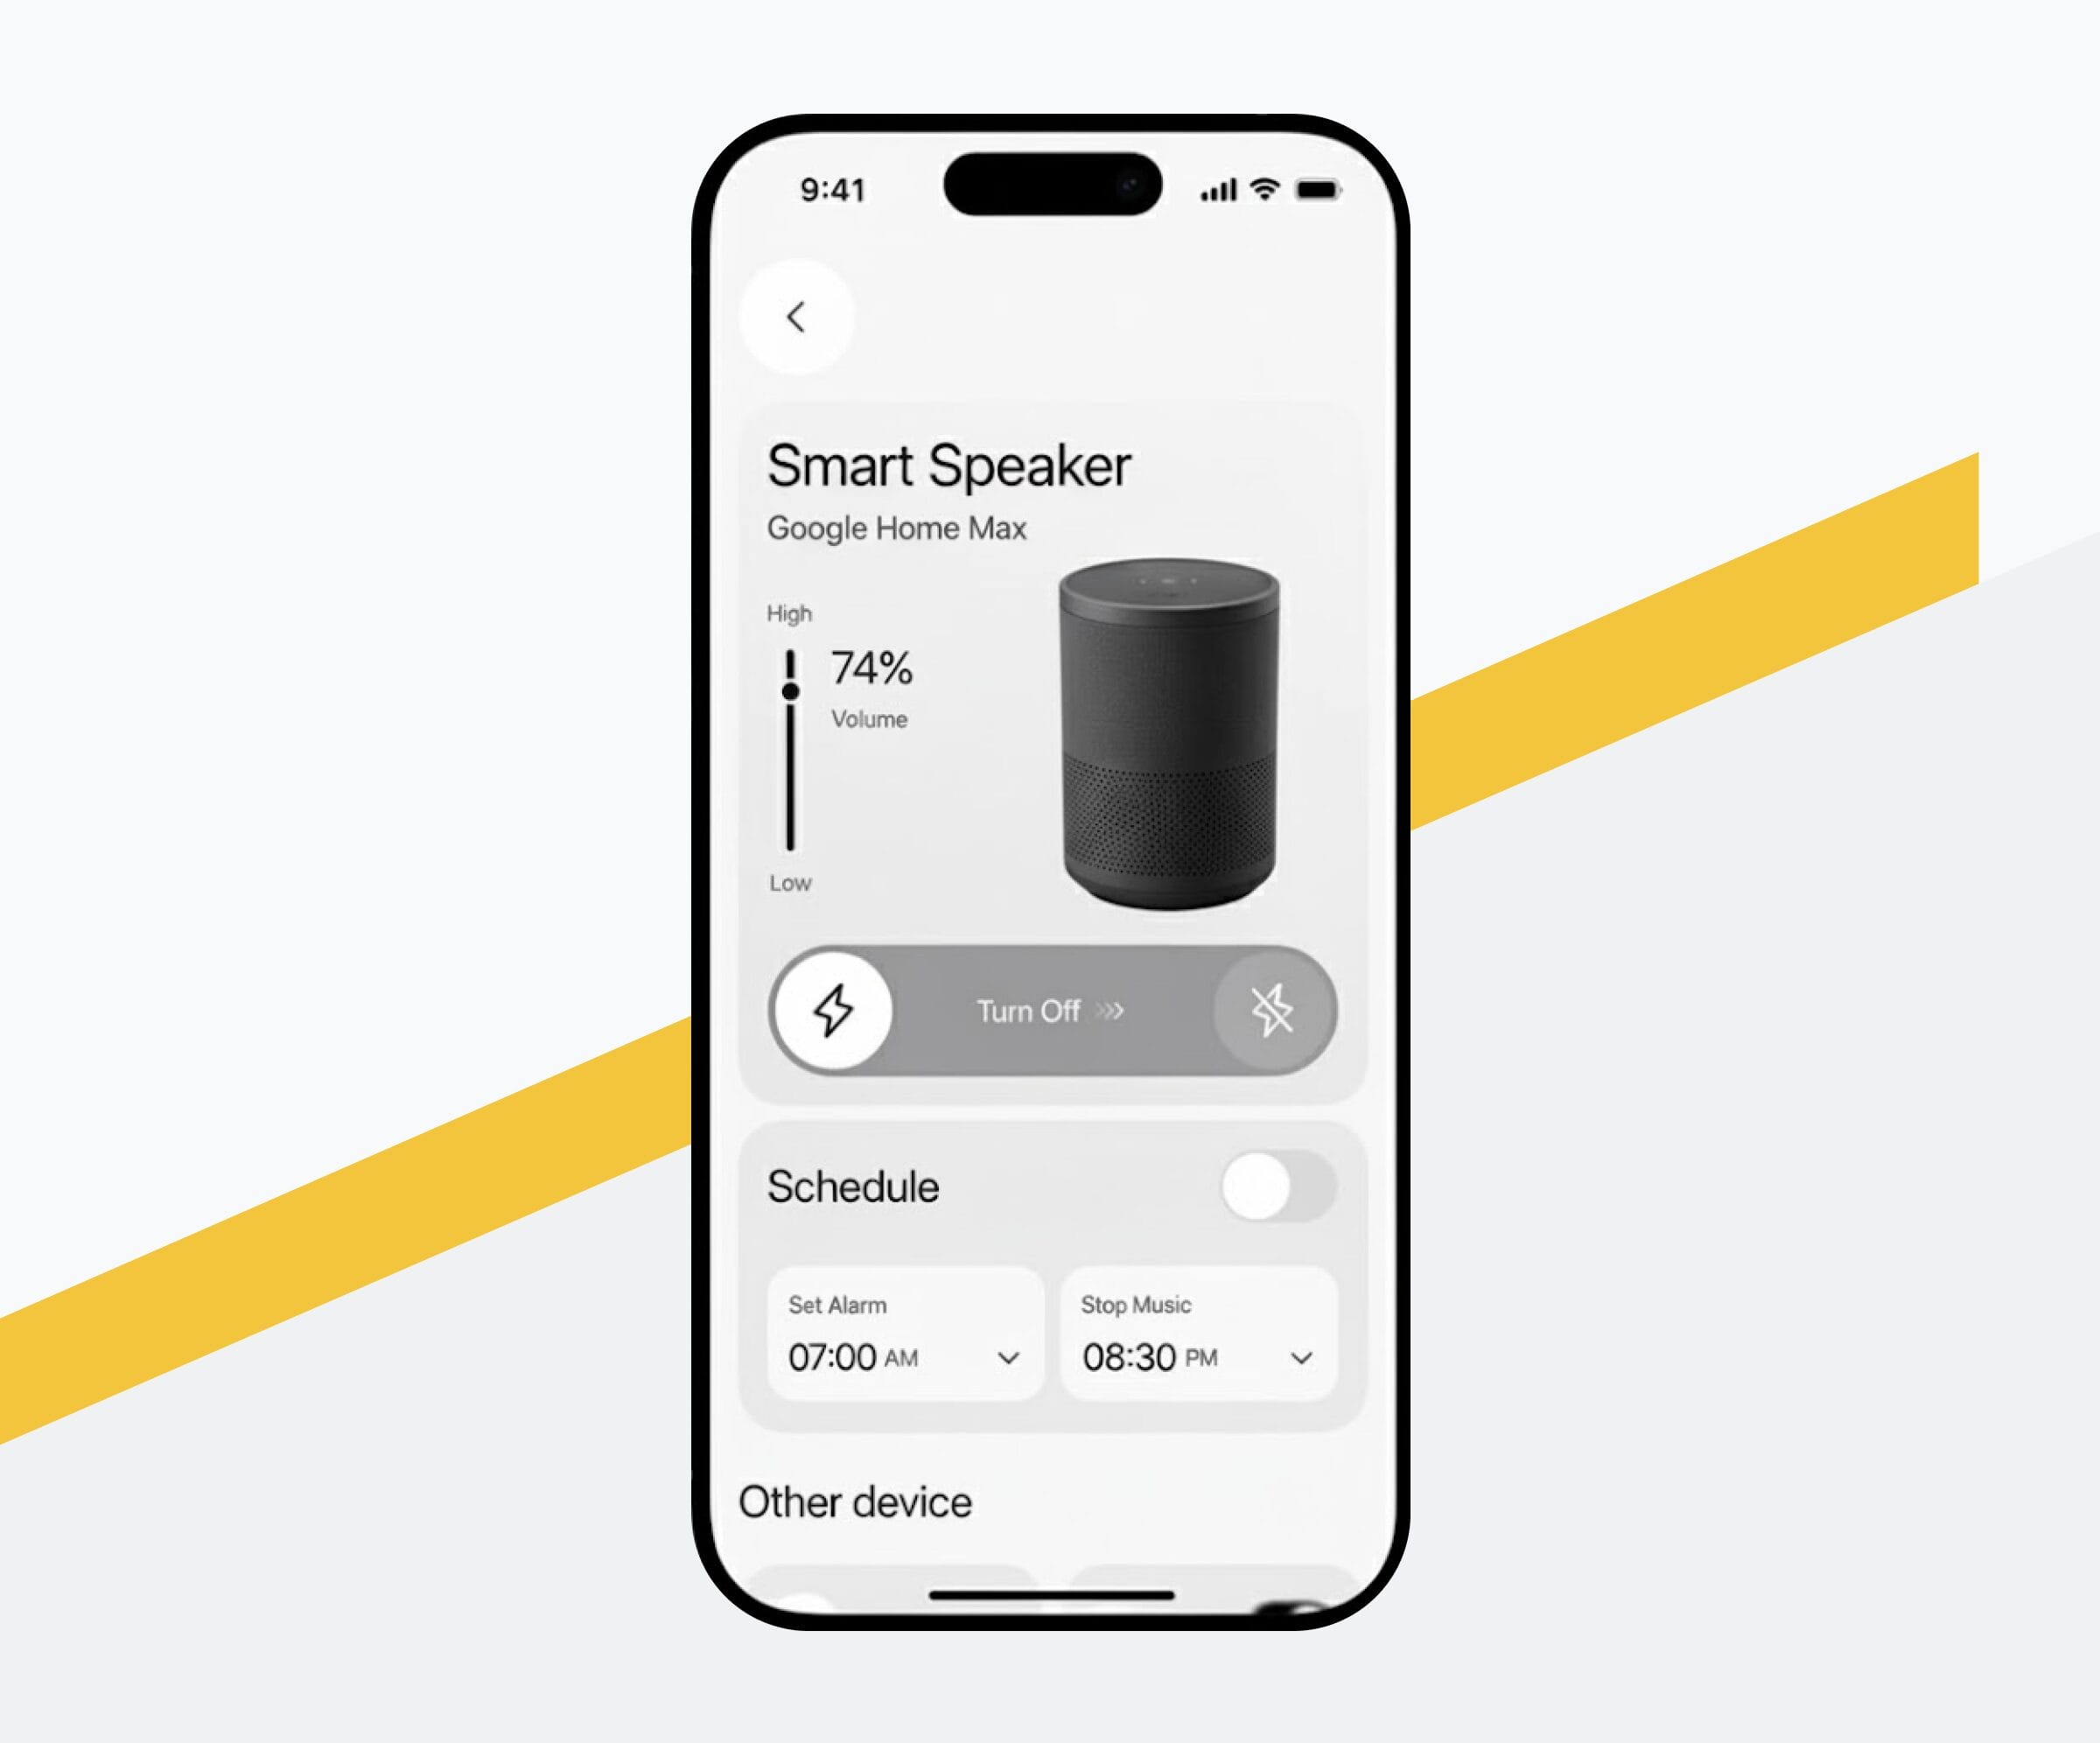
We combine 21+ years of proven experience in providing data visualization consulting services and 19 years in IoT development to create robust IoT data visualization tools that convert data generated by sensors, wearables and smart appliances into easy-to-comprehend visuals.

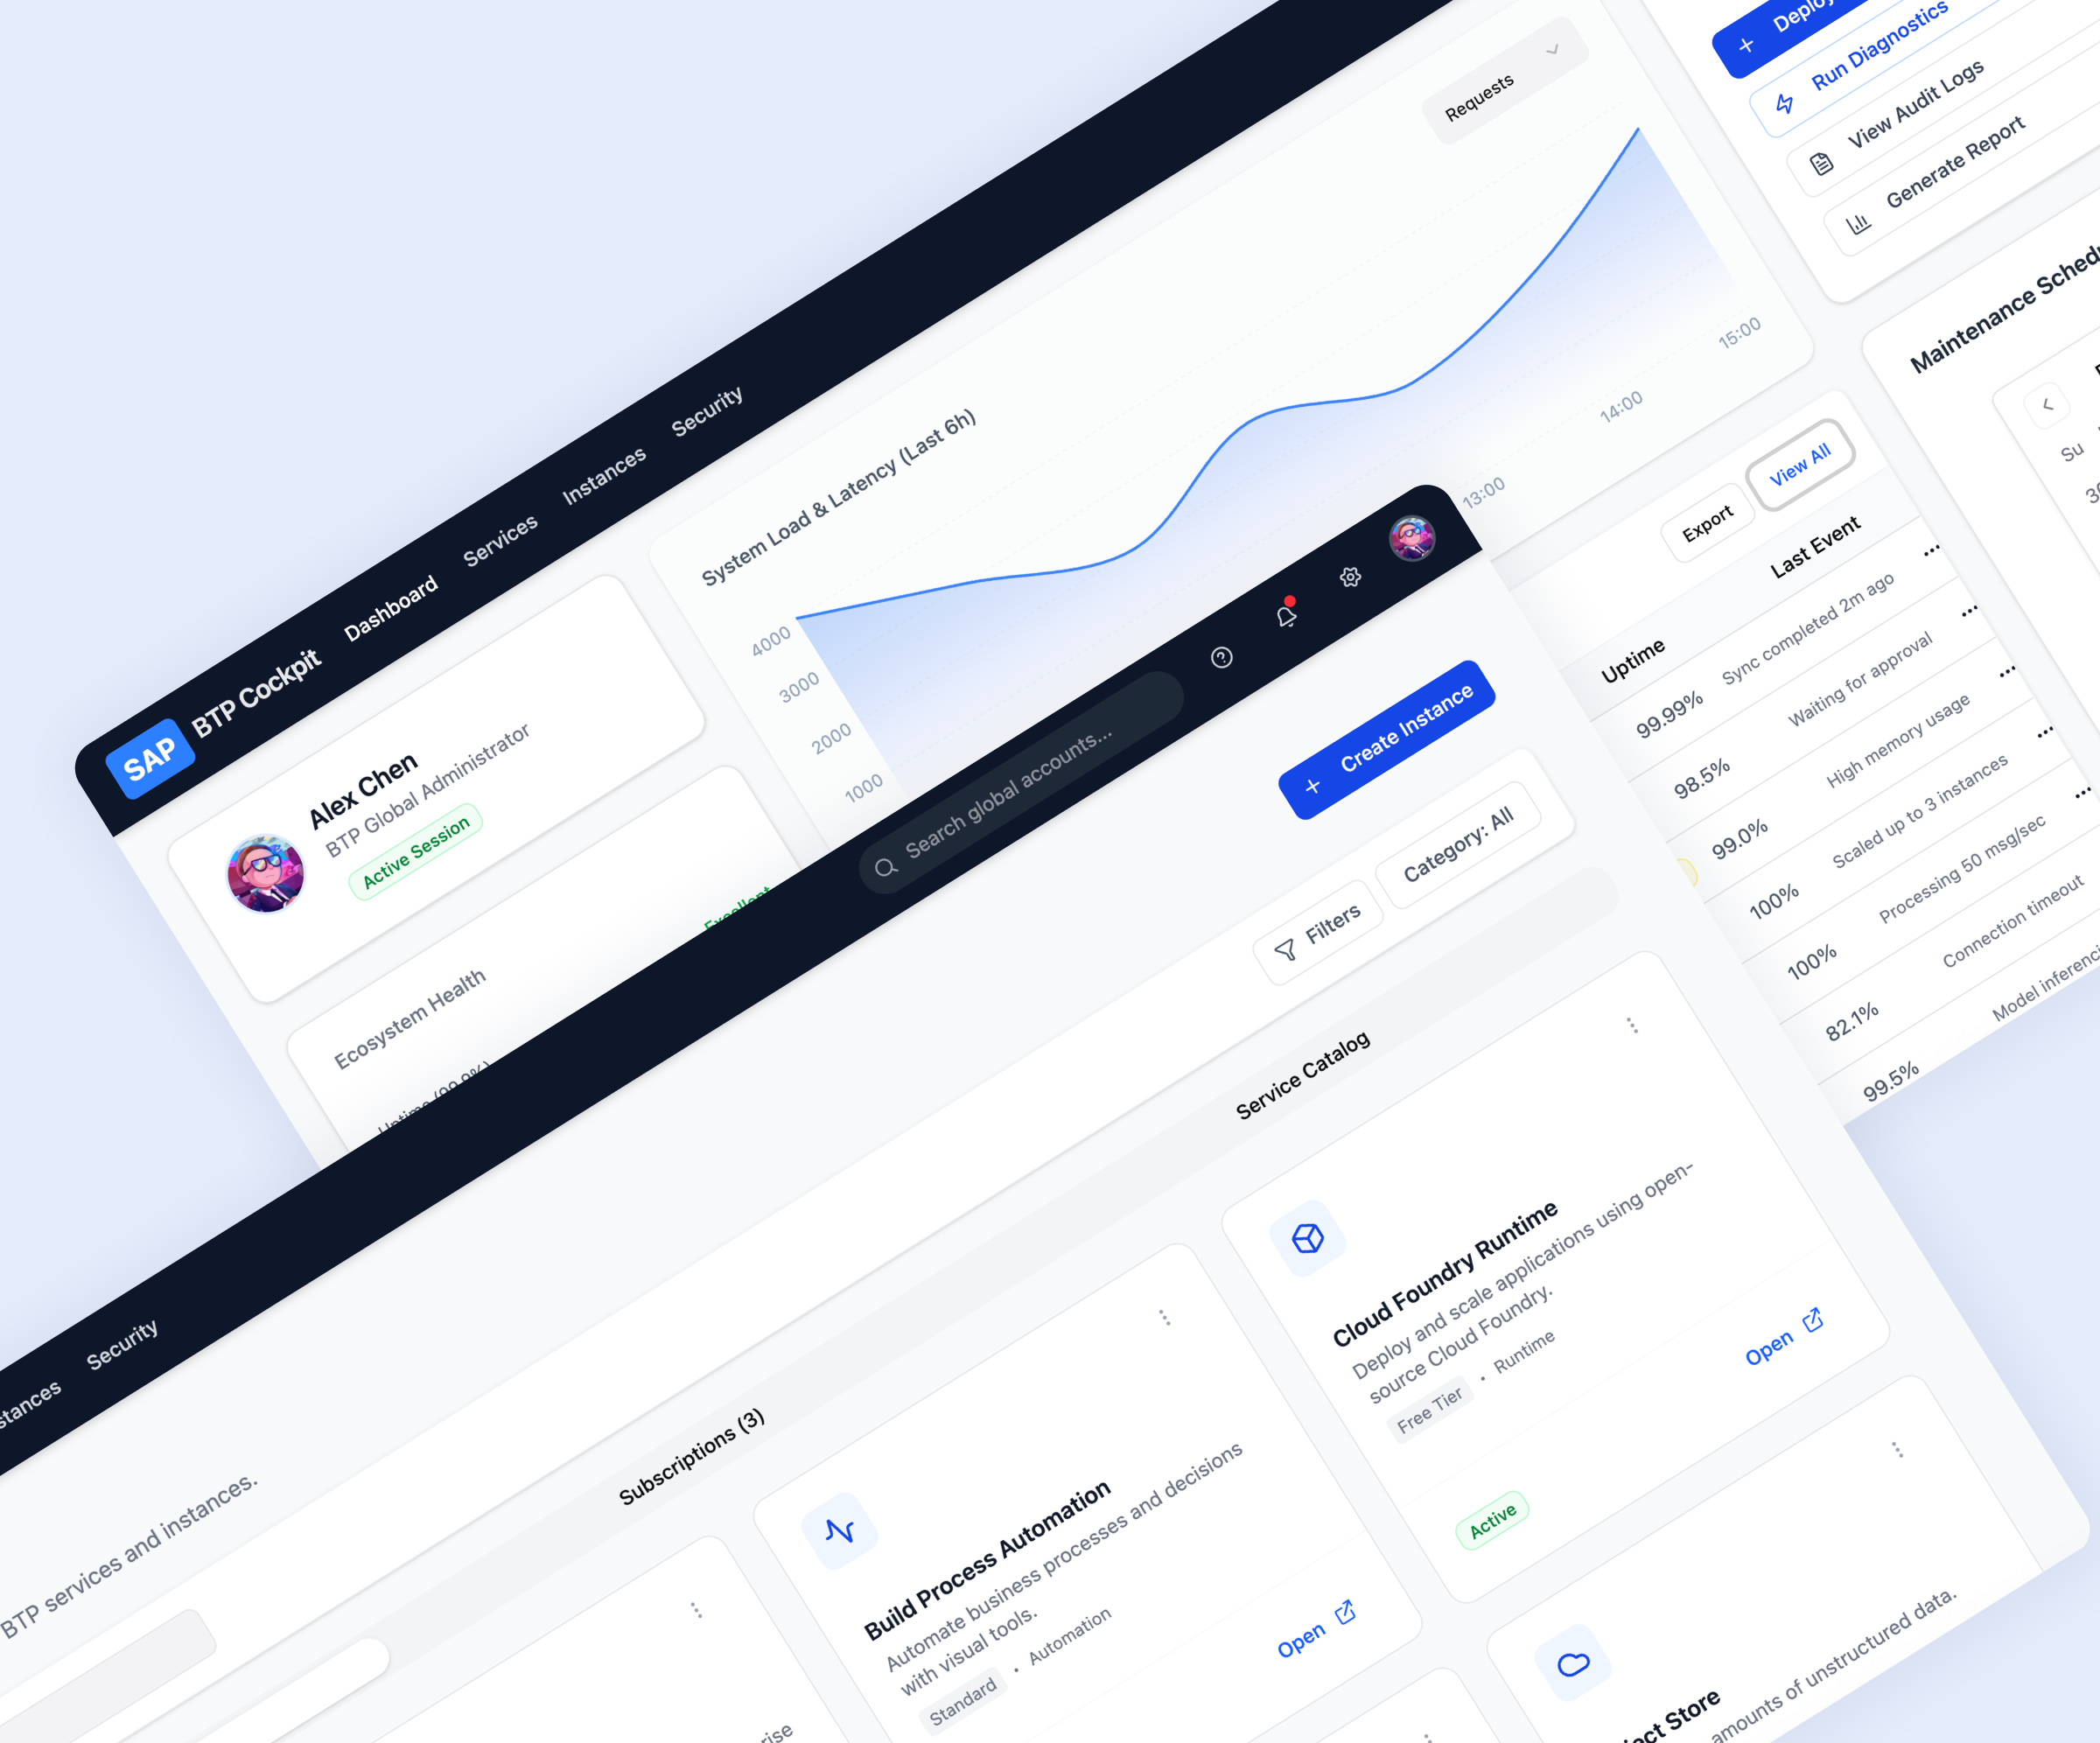
Armed with the insights absorbed from 11+ years of providing cloud development services and backed by ISO 9001 and ISO 27001 certificates, we develop reliable cloud data visualization tools that turn your complex datasets into value-generating machines.

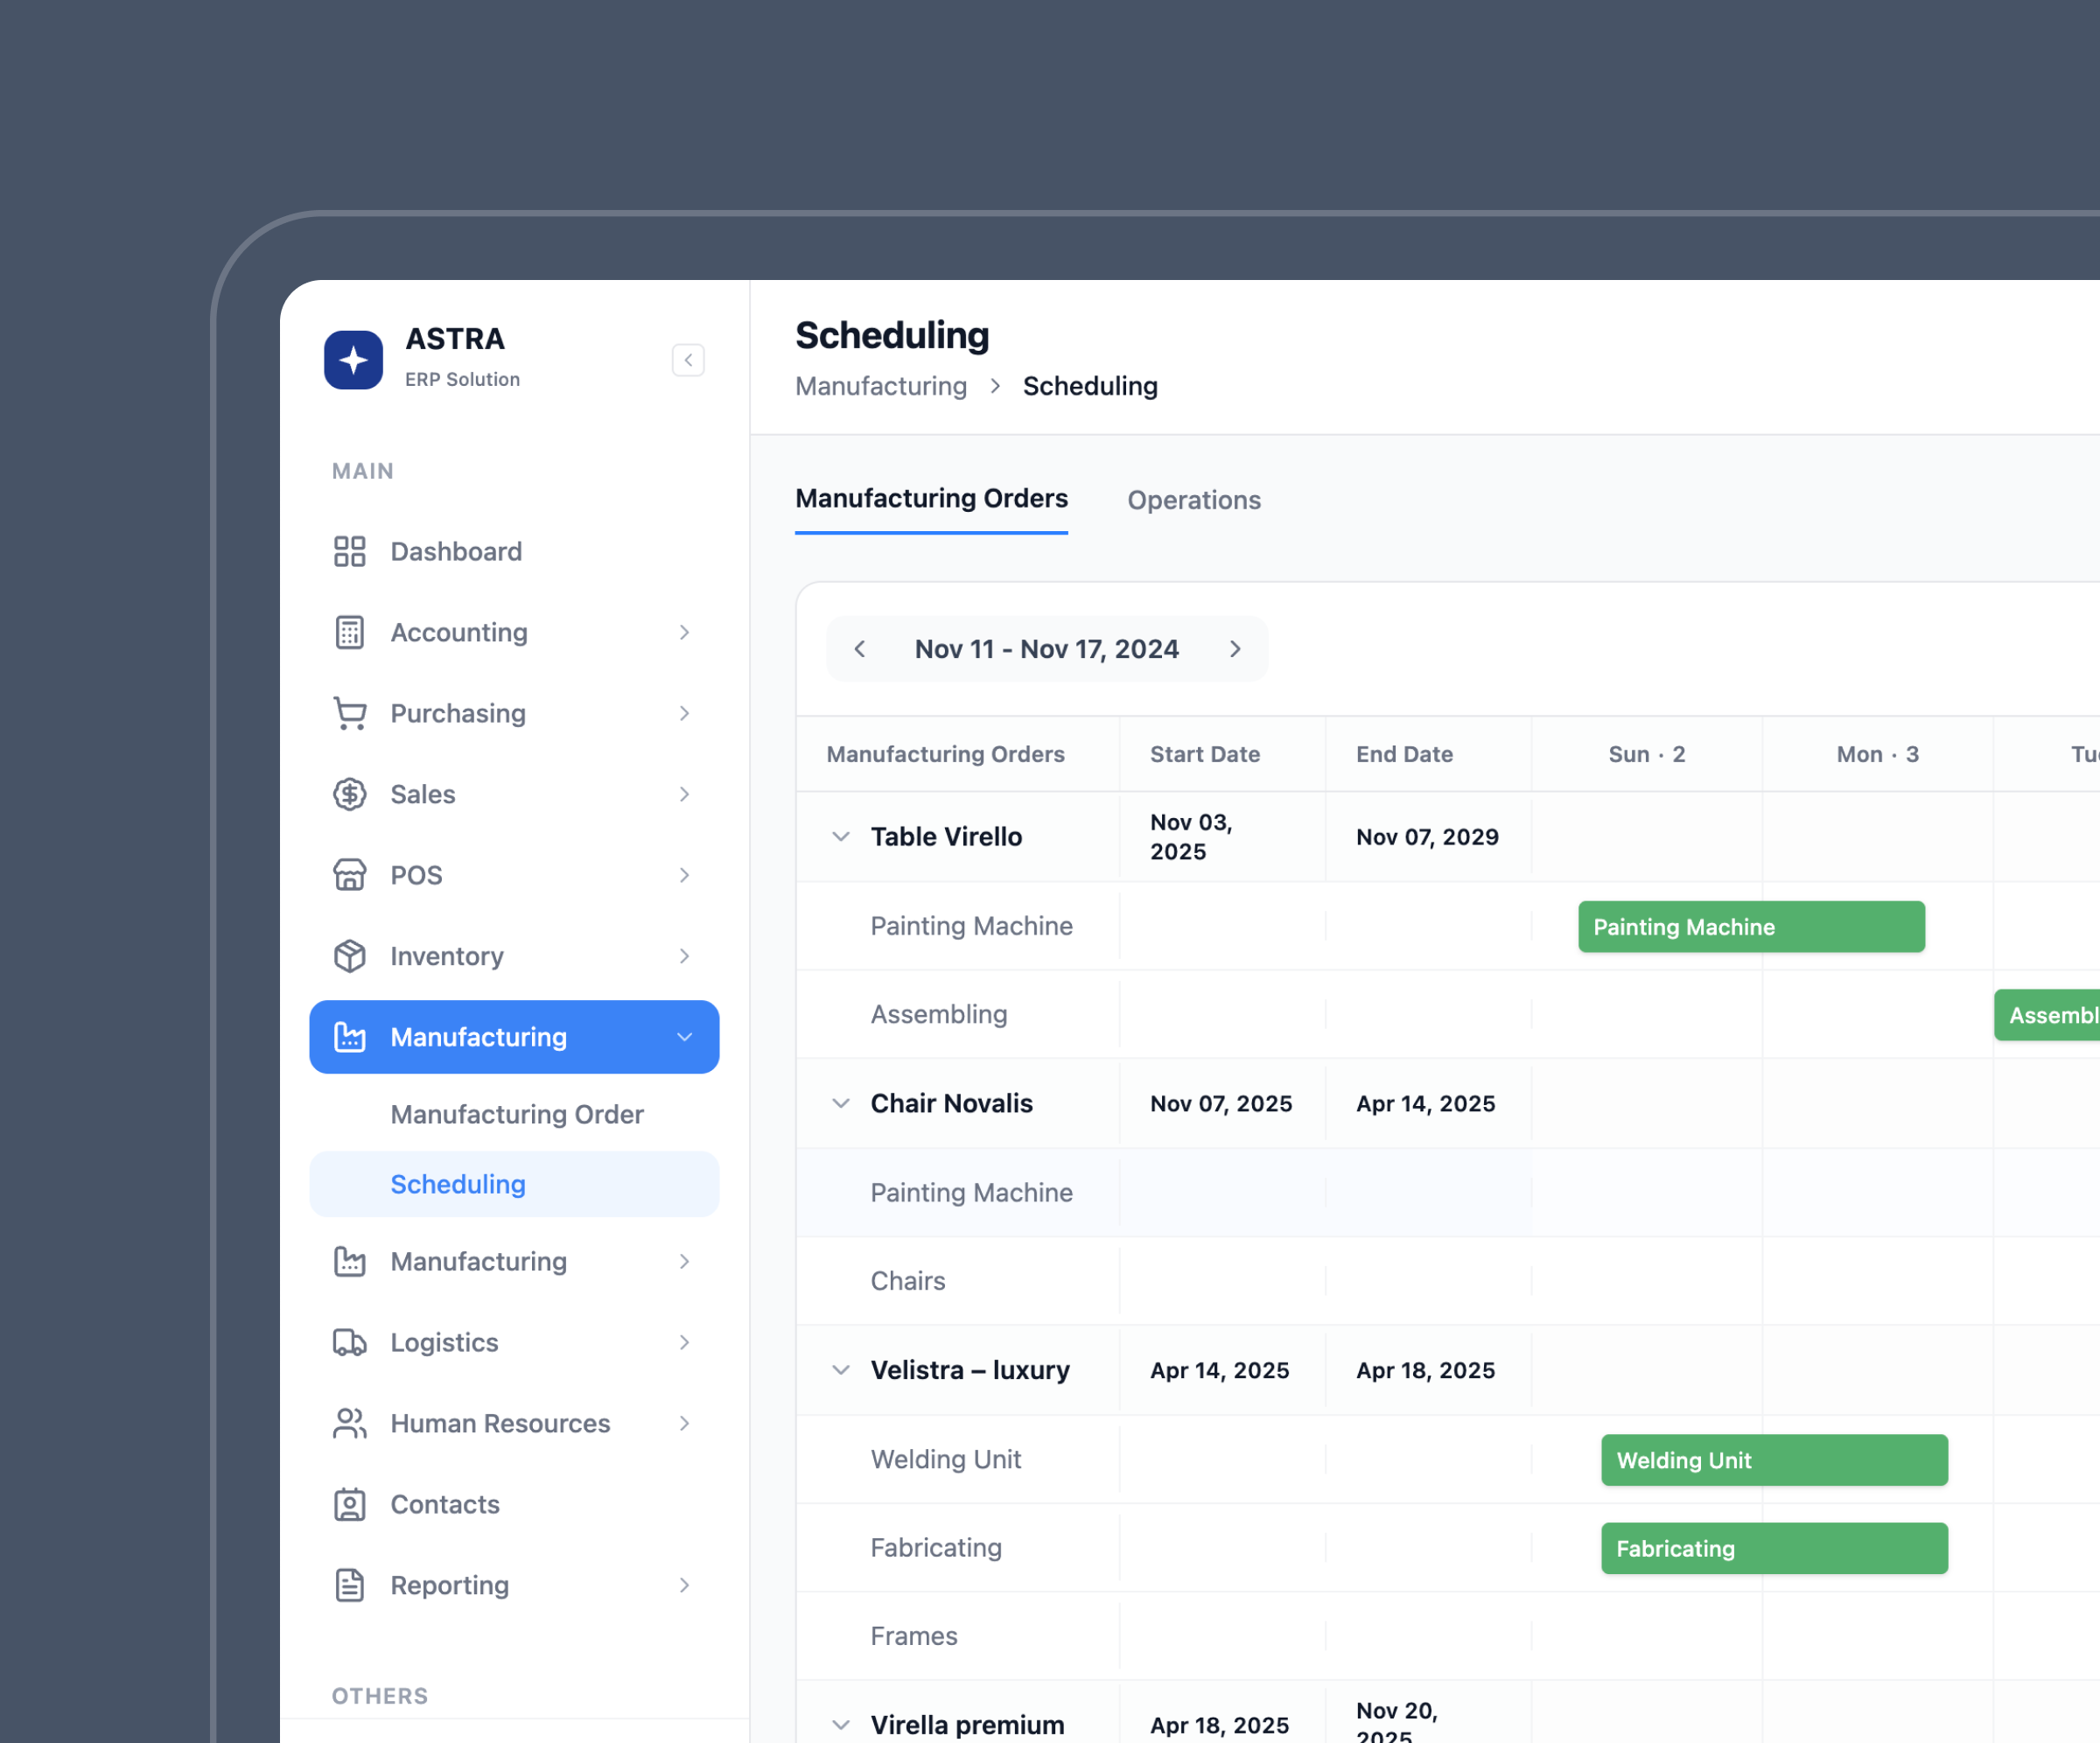
Develop next-level data analytics software with our senior ERP software developers ready to start within 3 business days. Measure, analyze and boost the performance of each enterprise.

Our data visualization services cover maintenance and support for both hardware and software components of tools your business relies on. From software troubleshooting to customization, integration with new systems, and beyond, we are here to assist you.
-
 Data Visualization Software Development
Partnering directly with clients, our seasoned, time-zone-aligned tech professionals having 7-12 years of expertise consult, build, implement, optimize and maintain your software solutions to help you ensure your data visualization is clear and meaningful.
-
Data Visualization Consulting Services
Whether you want to build tailored data visualization software or need to customize a ready-made solution, we can provide a piece of advice on matters like a best-suited toolkit, step-by-step software development and implementation and cost optimization strategy.
-
Data Visualization Implementation
Get in touch with our experts for any queries or assistance required as you implement your new data visualization solutions. From setup and configuration to testing, end-user training, and ongoing support, we ensure seamless adoption and maximum performance for everyone who needs it.
-
Data Visualization Optimization
Optimize your systems confidently with a mature data visualization solutions company by your side. Improve the source code, add advanced features, enhance the overall speed or migrate seamlessly to the cloud by using the services of an IT provider with 20+ relevant projects under its belt.
-
Data Platform Development
Delegate your project to a reputable data visualization solutions company and enjoy the headache-free development of a modern platform that will aggregate, clean, transform, and analyze your organization’s data helping surface useful insights.
-
Custom Reports Development
Struggling with standard reports that do not reflect the reality of your business? Let us help. At Elinext, we create complex custom reports by merging multi-source data, automate endless, error-prone copy-pasting and cut report generation time from days to minutes.
-
Entrust the development of BI data visualization solutions to the IT vendor with 28+ years of relevant expertise. Operating across industries, we build BI dashboards and reports that morph raw business data into visually interactive insights that help users at all levels.
-
Hire data visualization services from a company boasting 20+ successfully delivered Big Data projects. Use Big Data solutions to see trends, identify risks, update existing products/services and innovate while the hired handles all technicalities.
-
We combine 21+ years of proven experience in providing data visualization consulting services and 19 years in IoT development to create robust IoT data visualization tools that convert data generated by sensors, wearables and smart appliances into easy-to-comprehend visuals.
-
Armed with the insights absorbed from 11+ years of providing cloud development services and backed by ISO 9001 and ISO 27001 certificates, we develop reliable cloud data visualization tools that turn your complex datasets into value-generating machines.
-
Develop next-level data analytics software with our senior ERP software developers ready to start within 3 business days. Measure, analyze and boost the performance of each enterprise.
-
Our data visualization services cover maintenance and support for both hardware and software components of tools your business relies on. From software troubleshooting to customization, integration with new systems, and beyond, we are here to assist you.
Our Awards and Recognitions


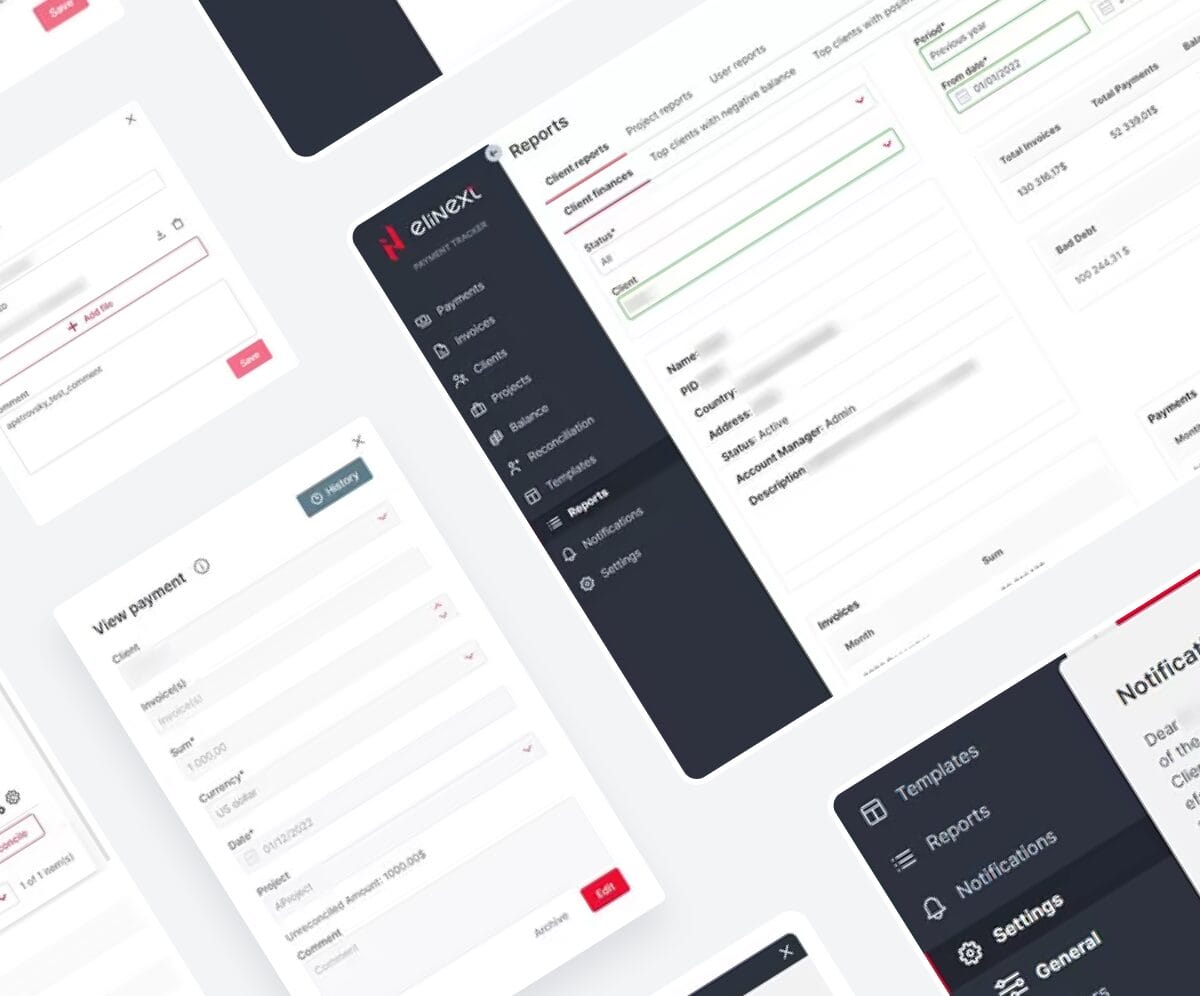
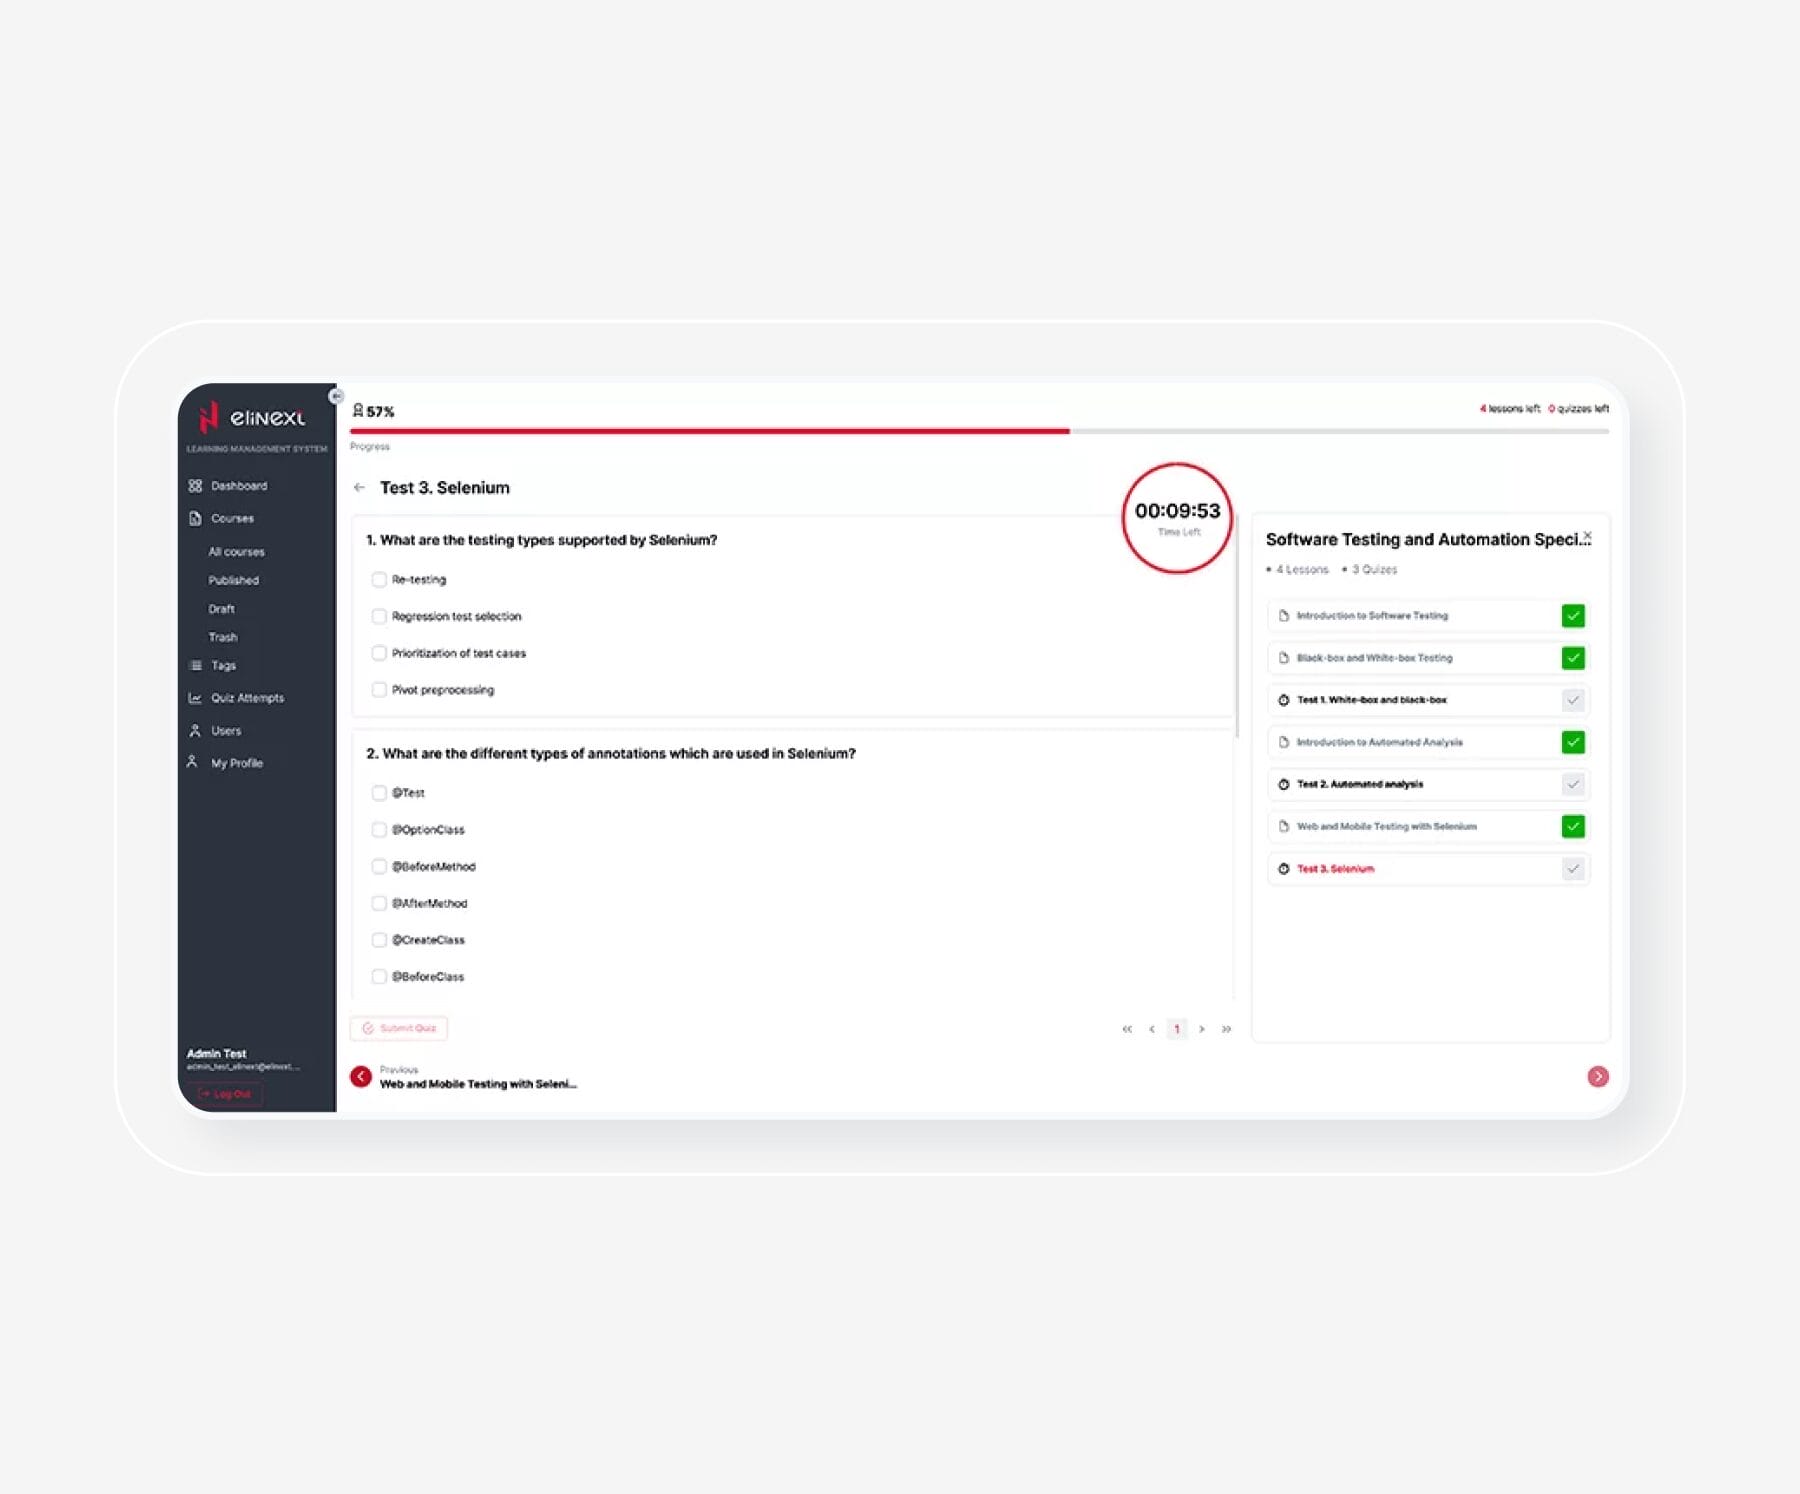
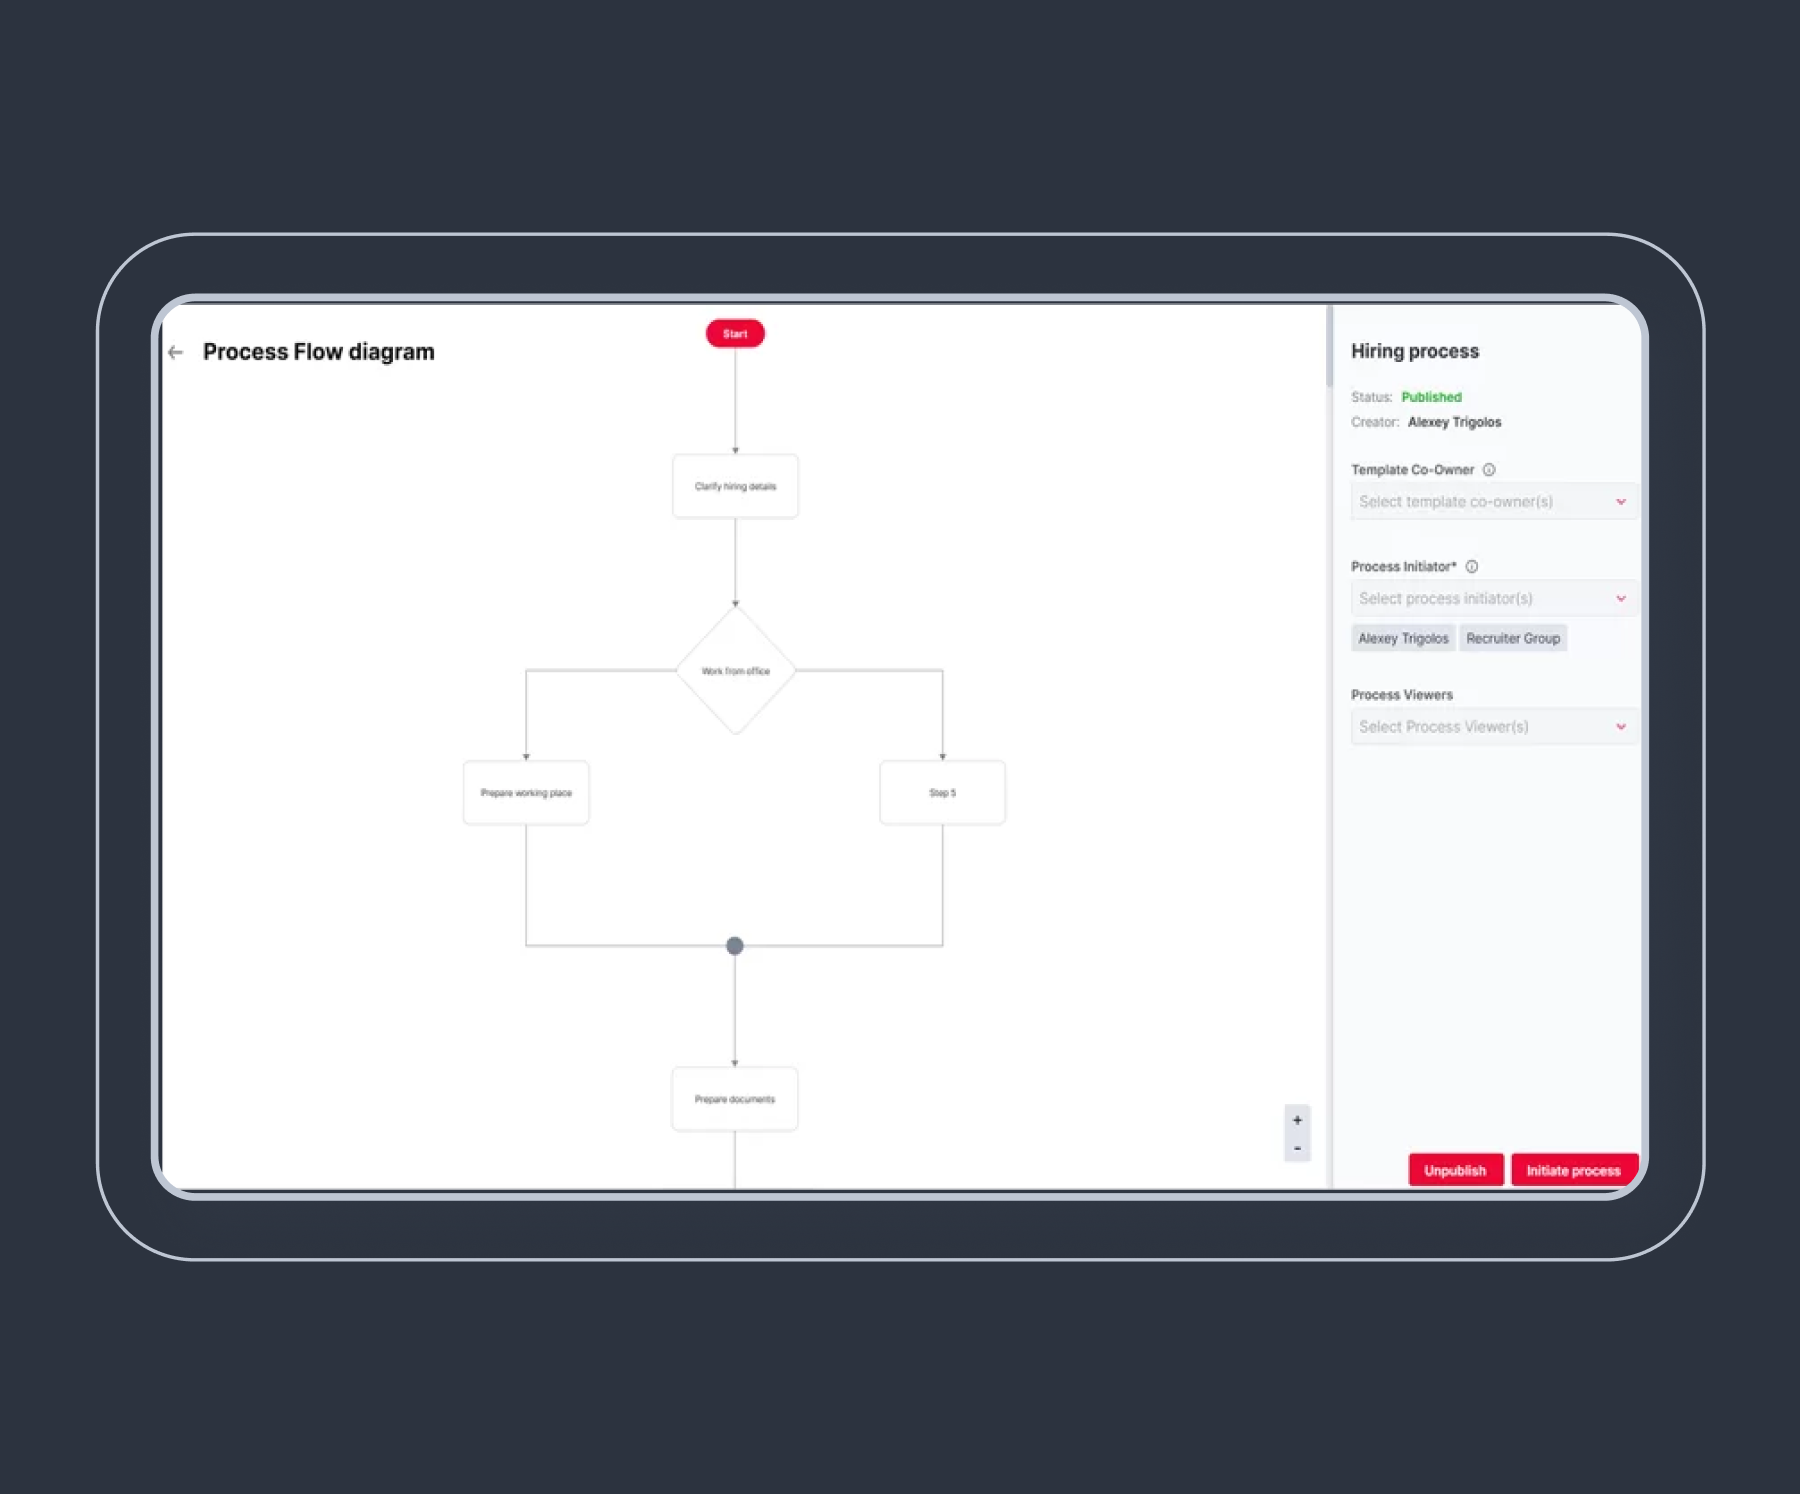
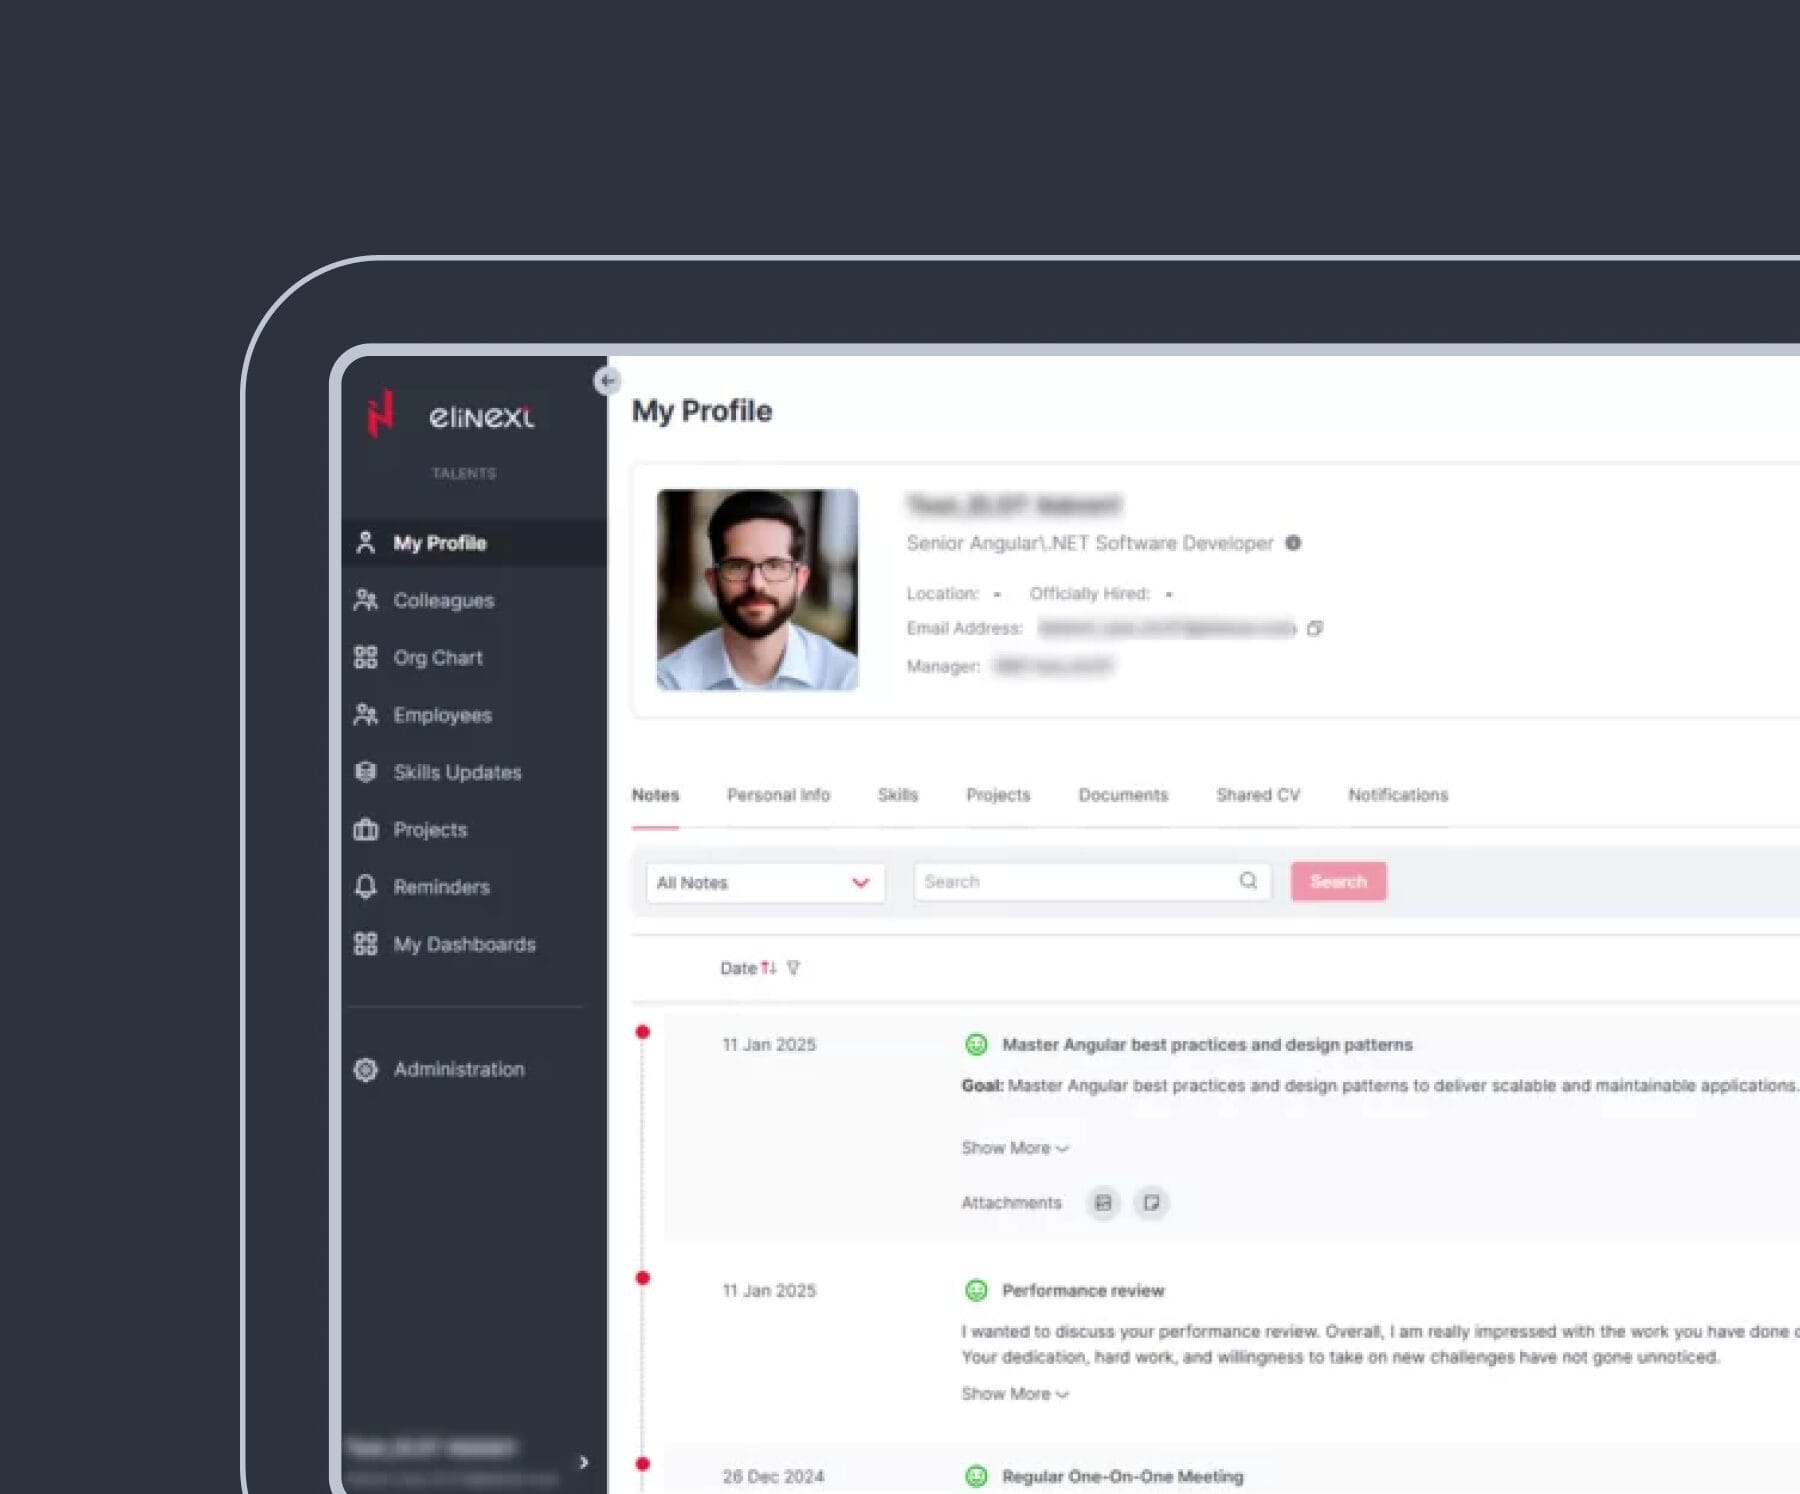
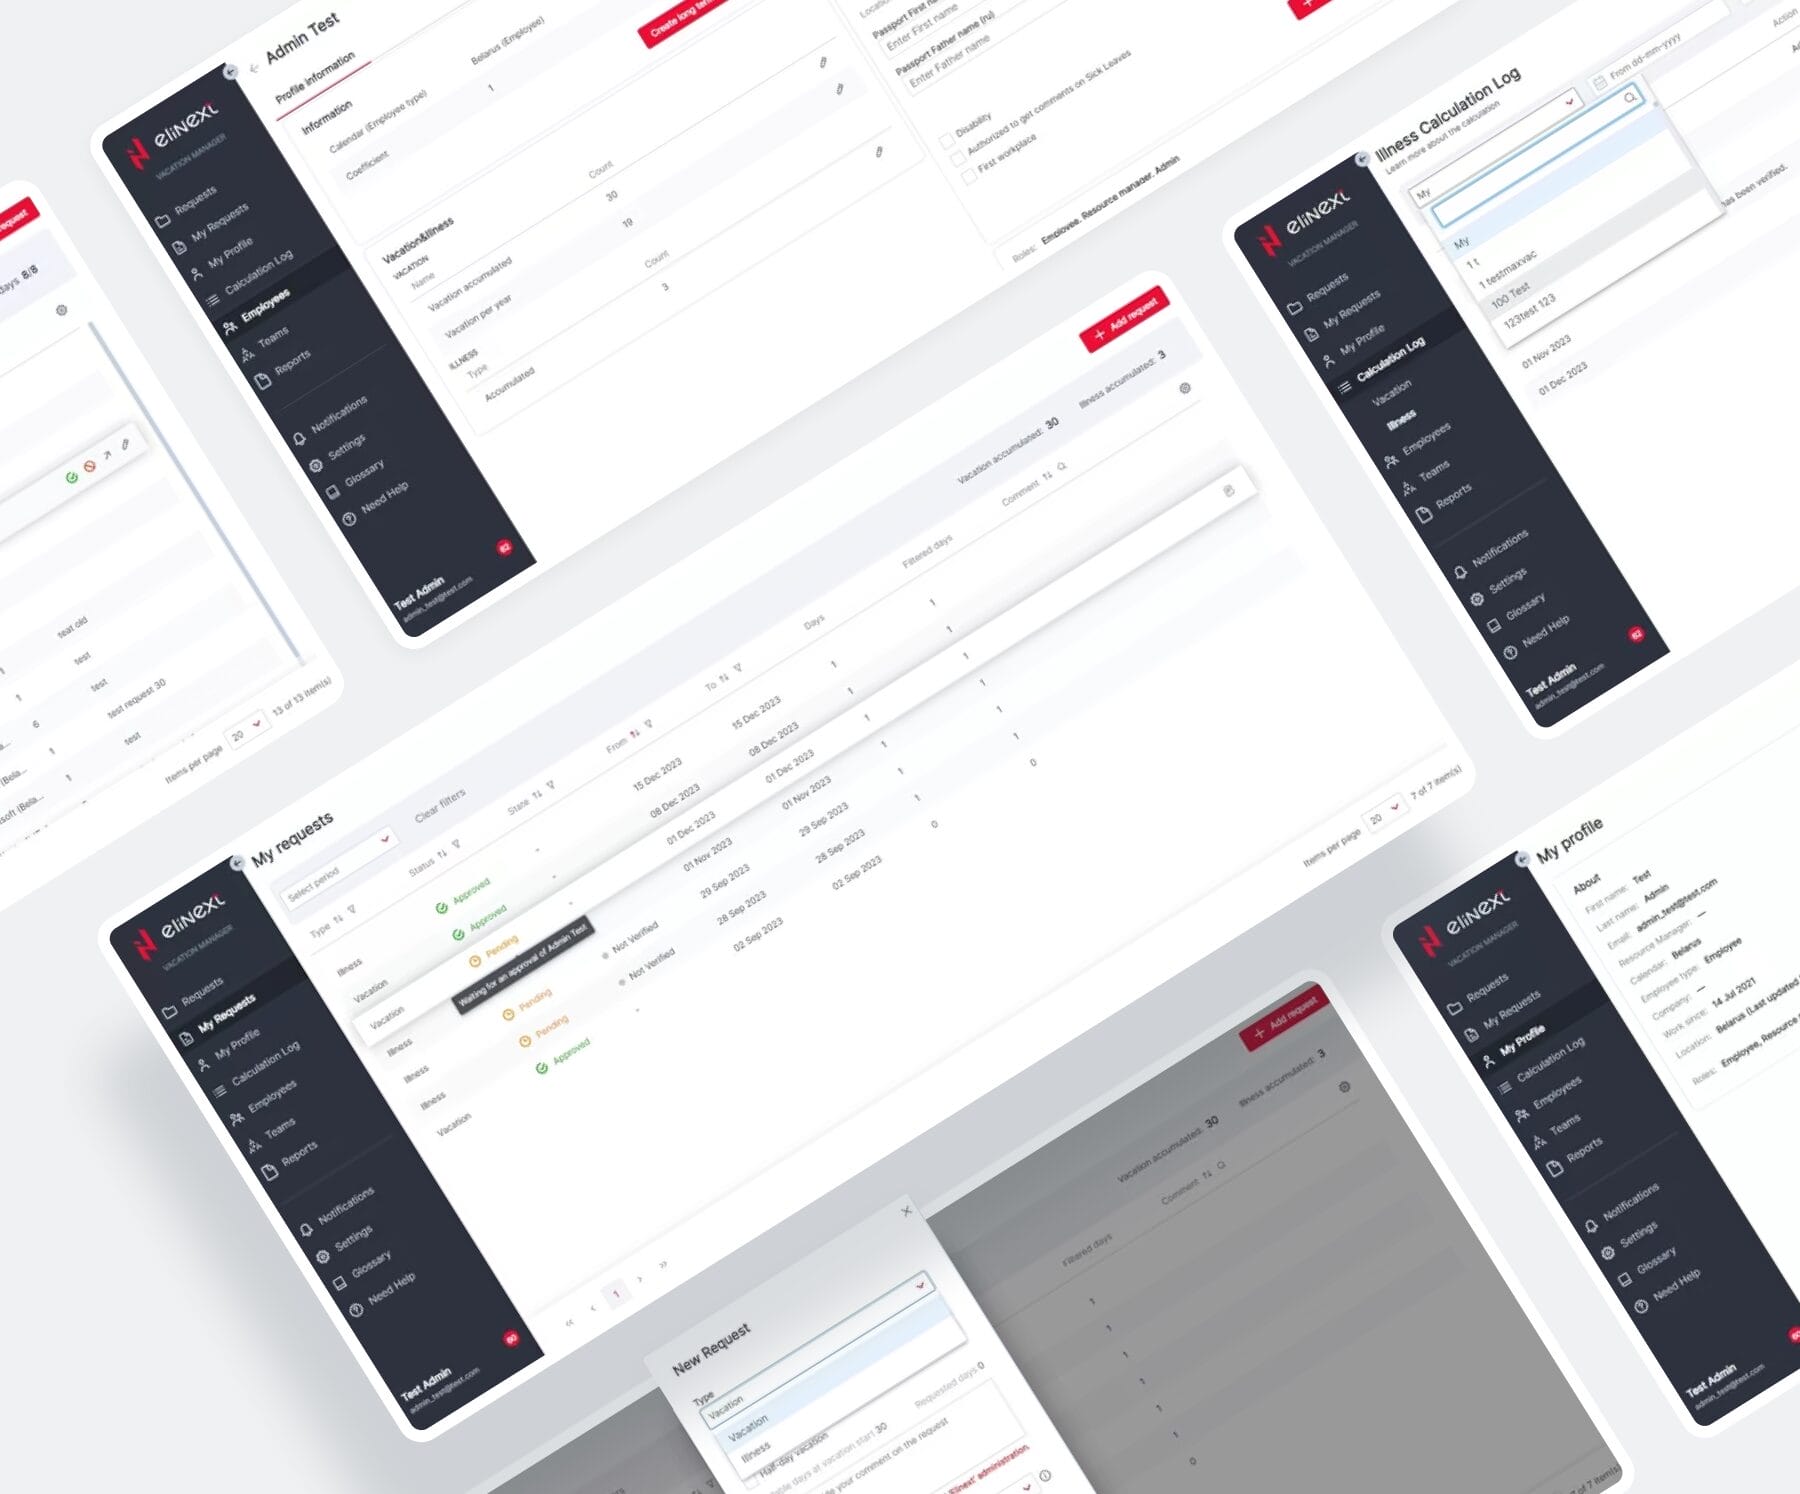
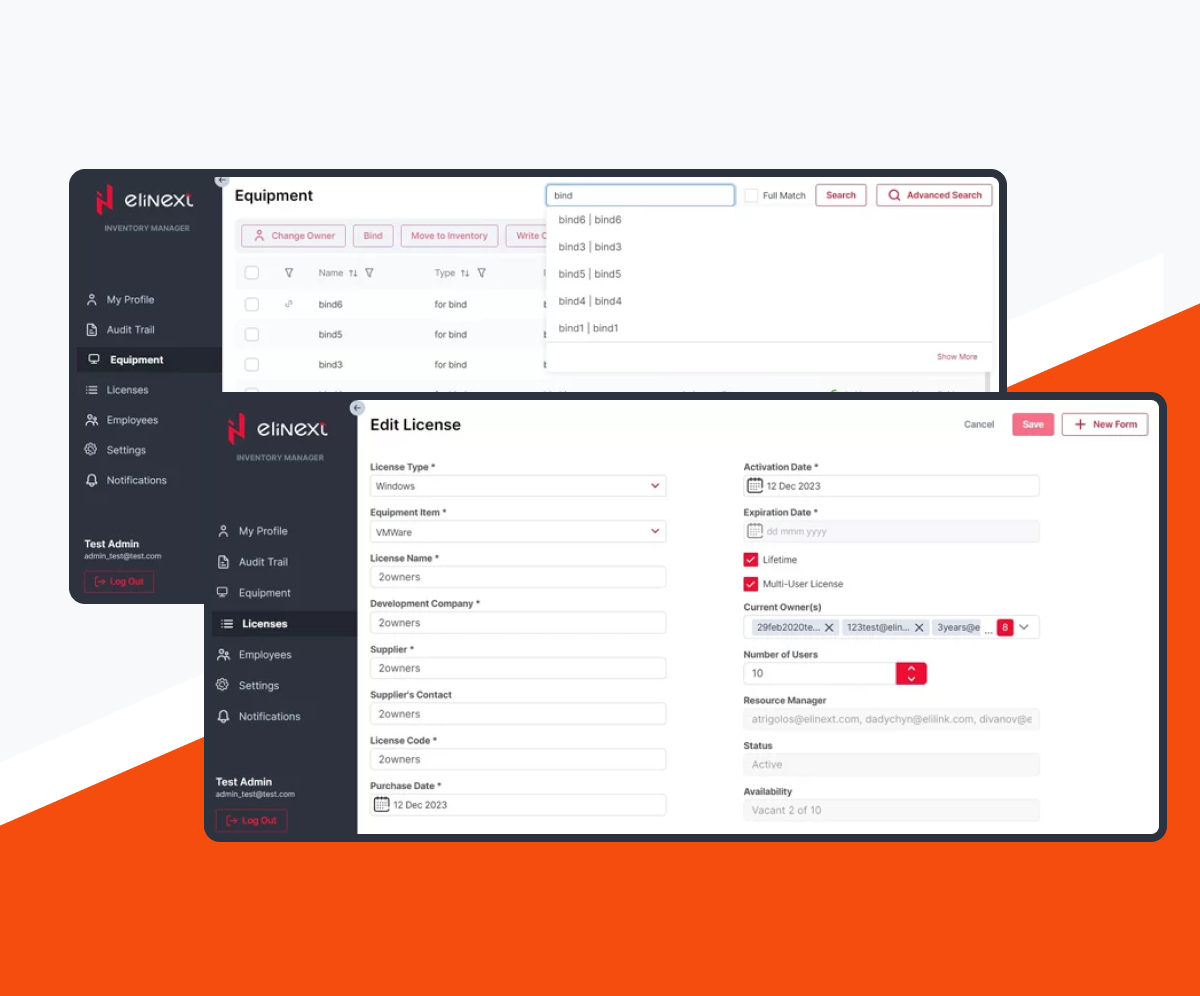
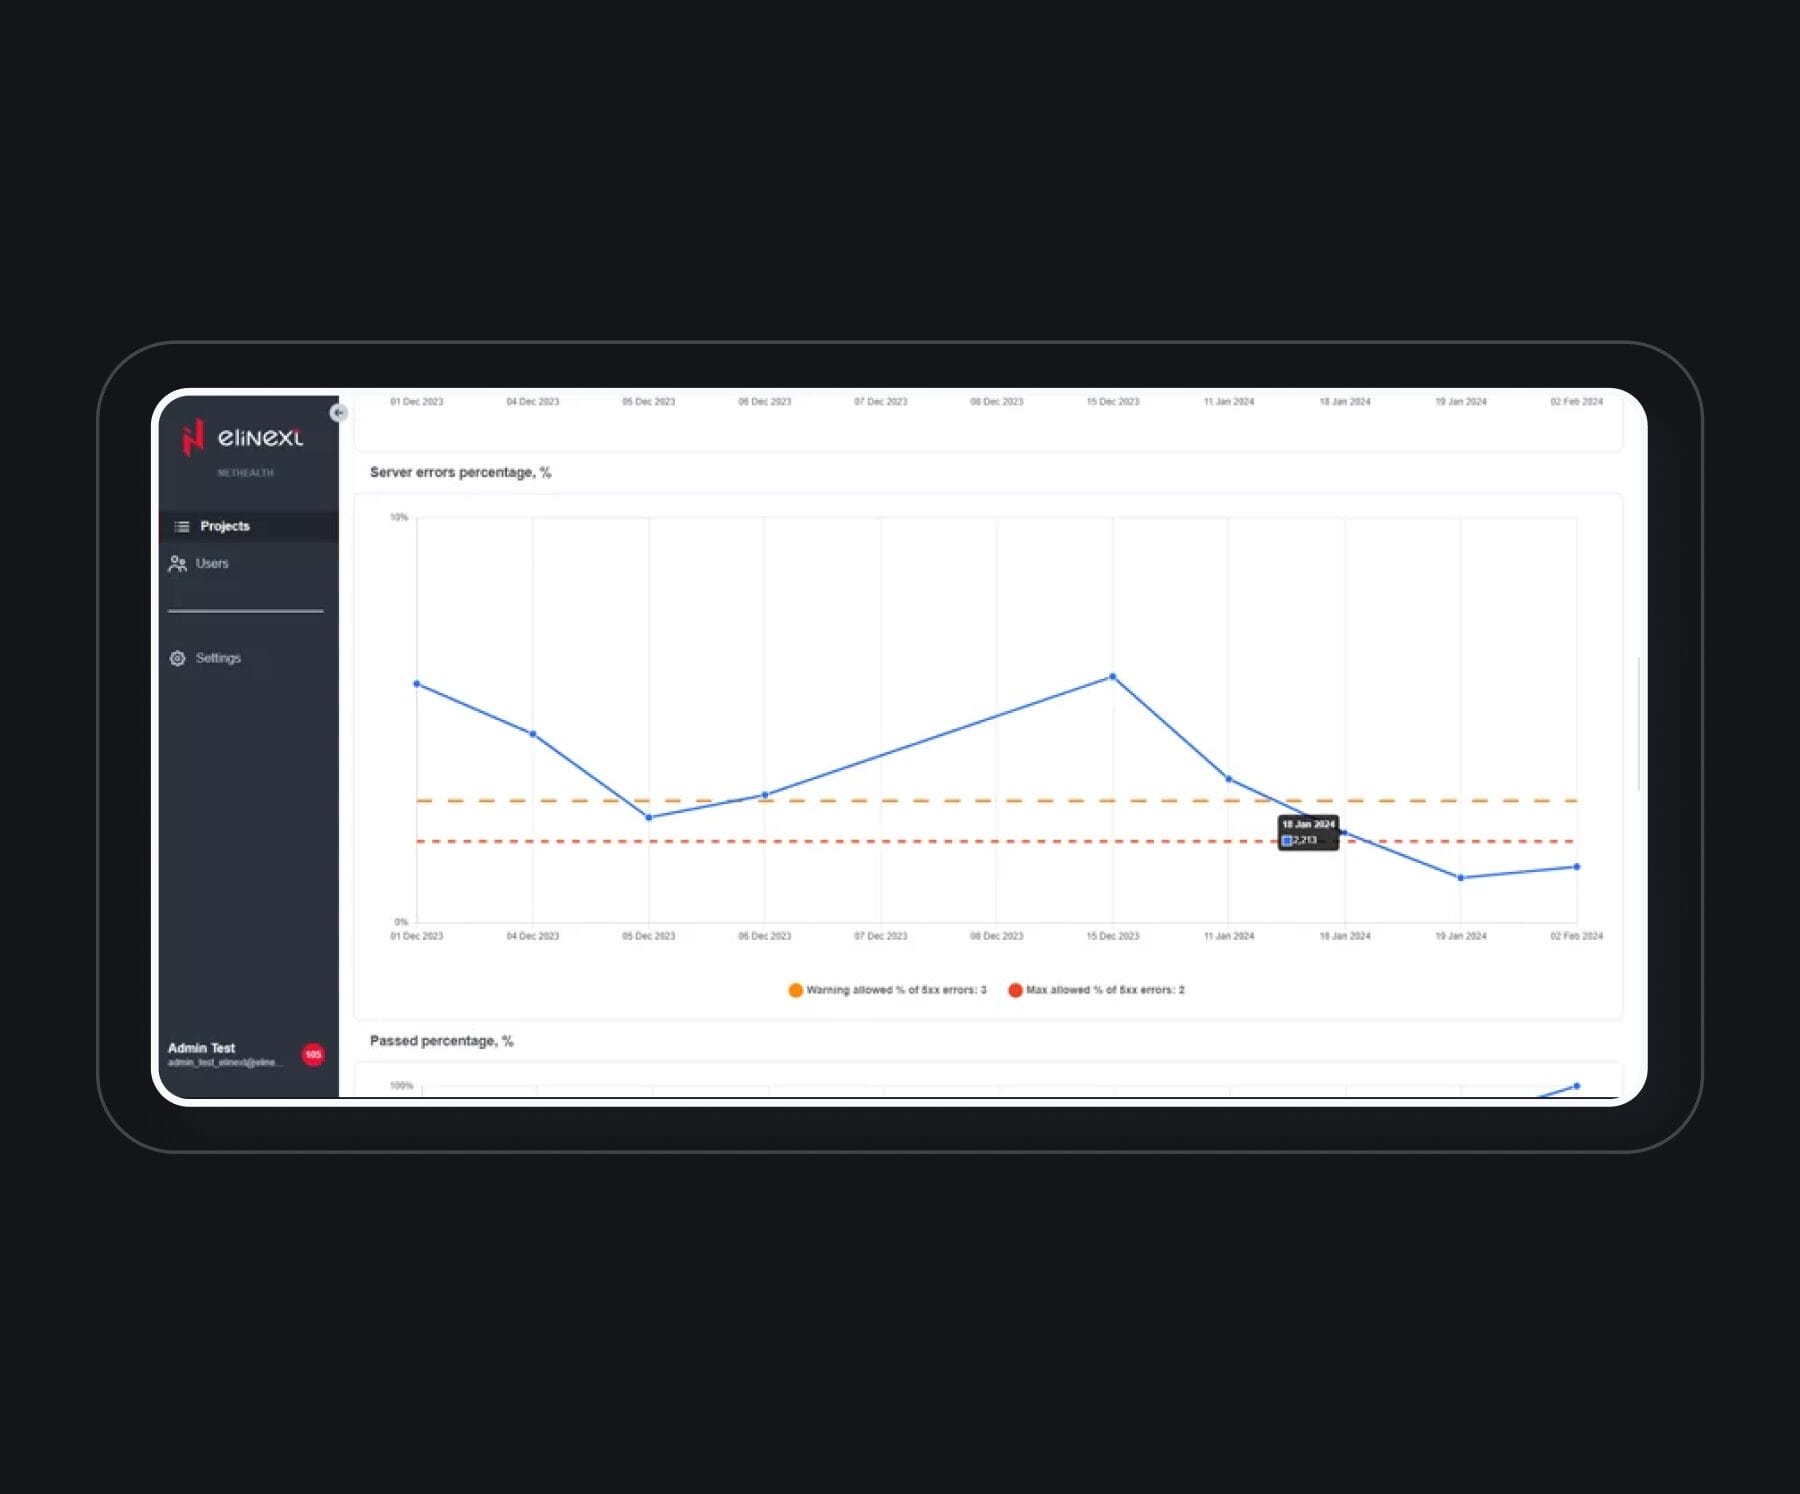
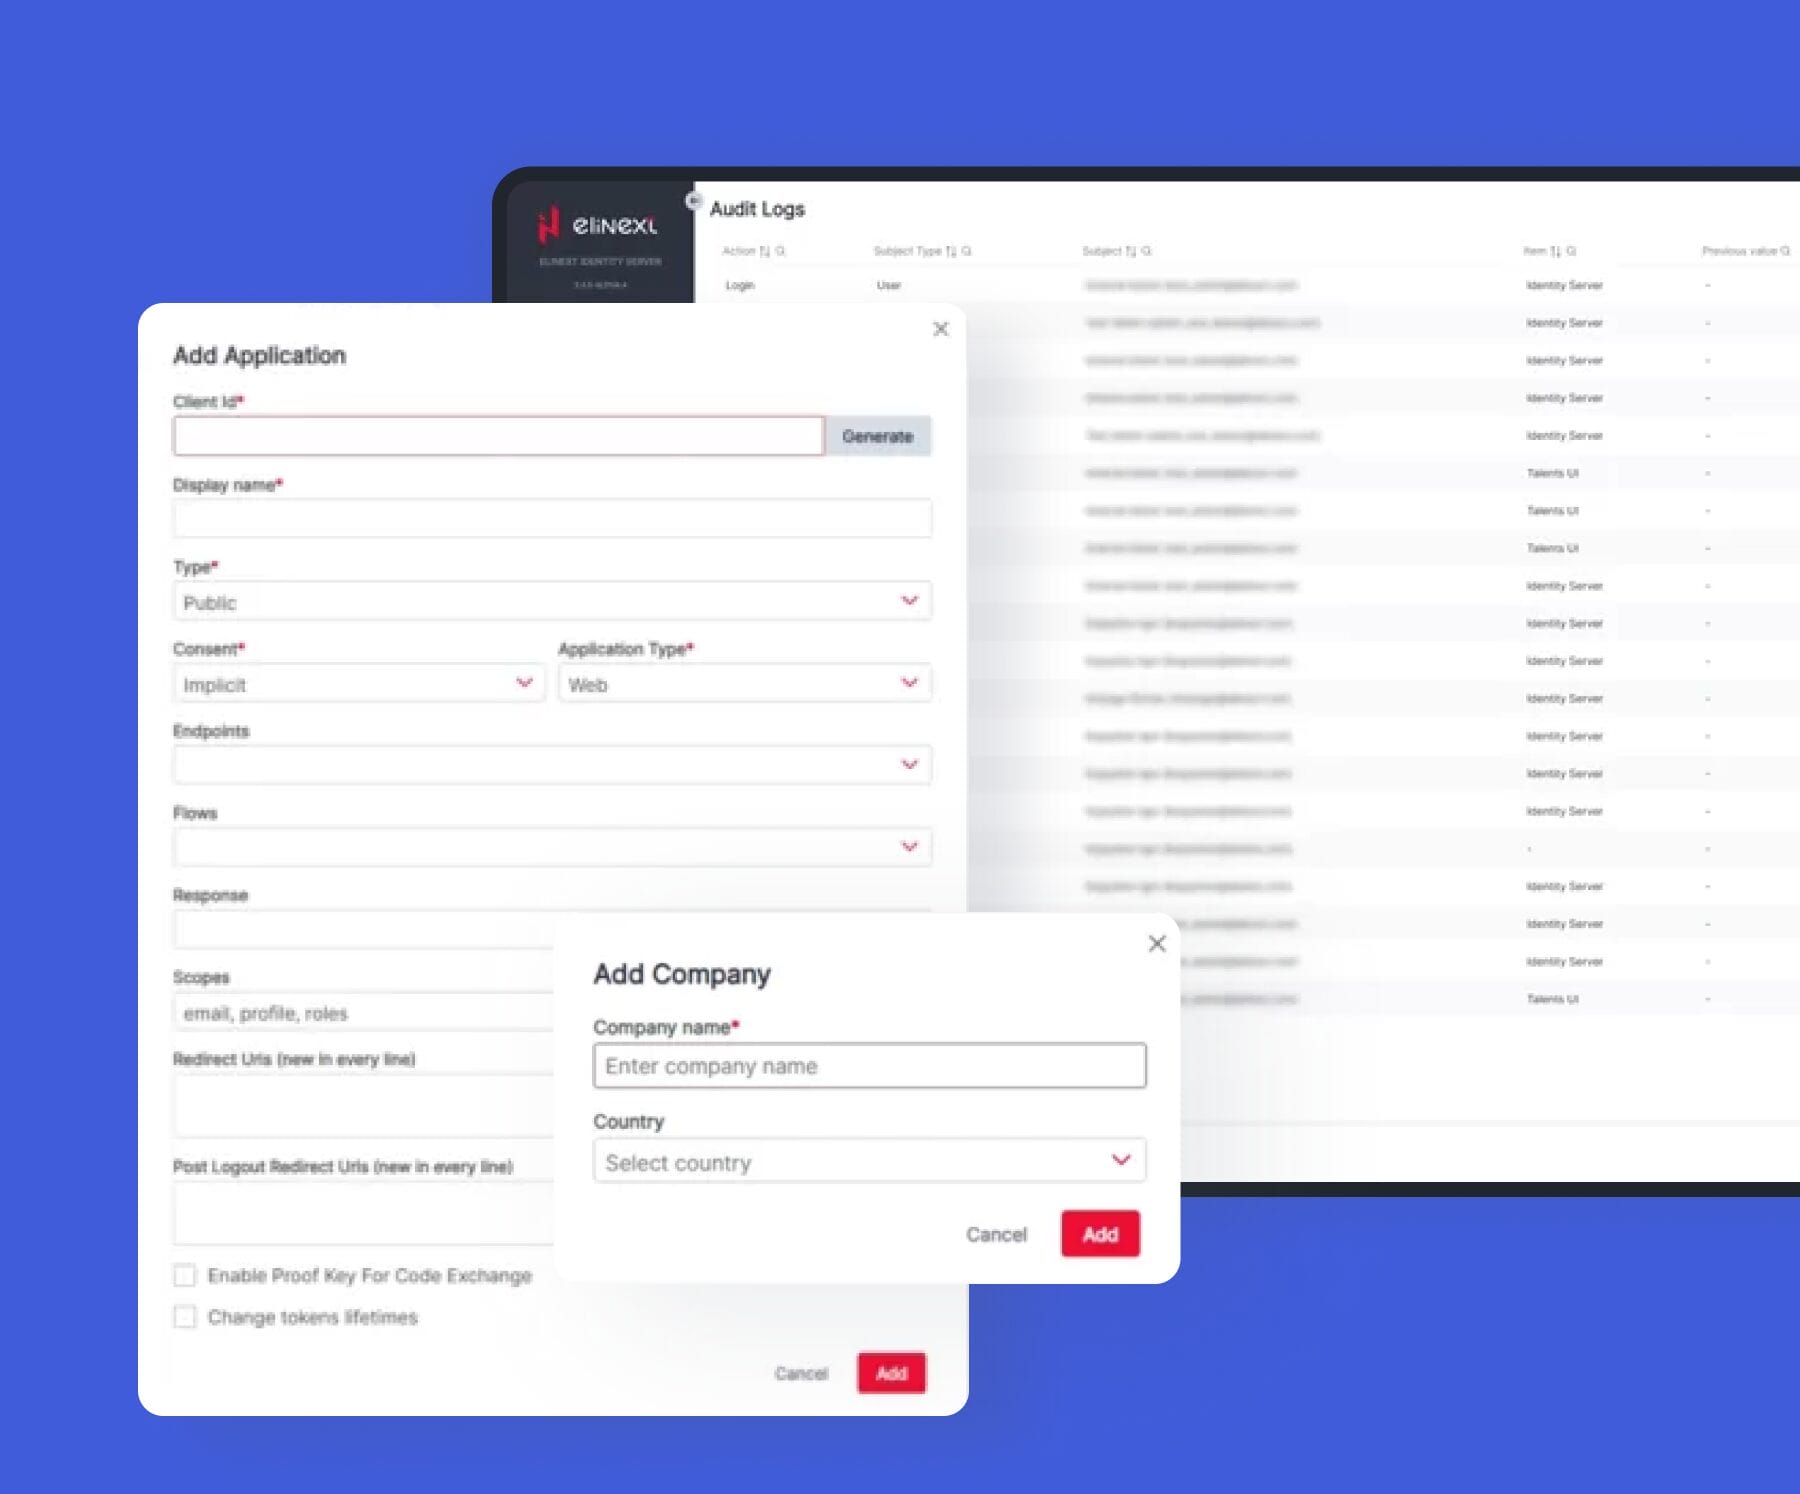
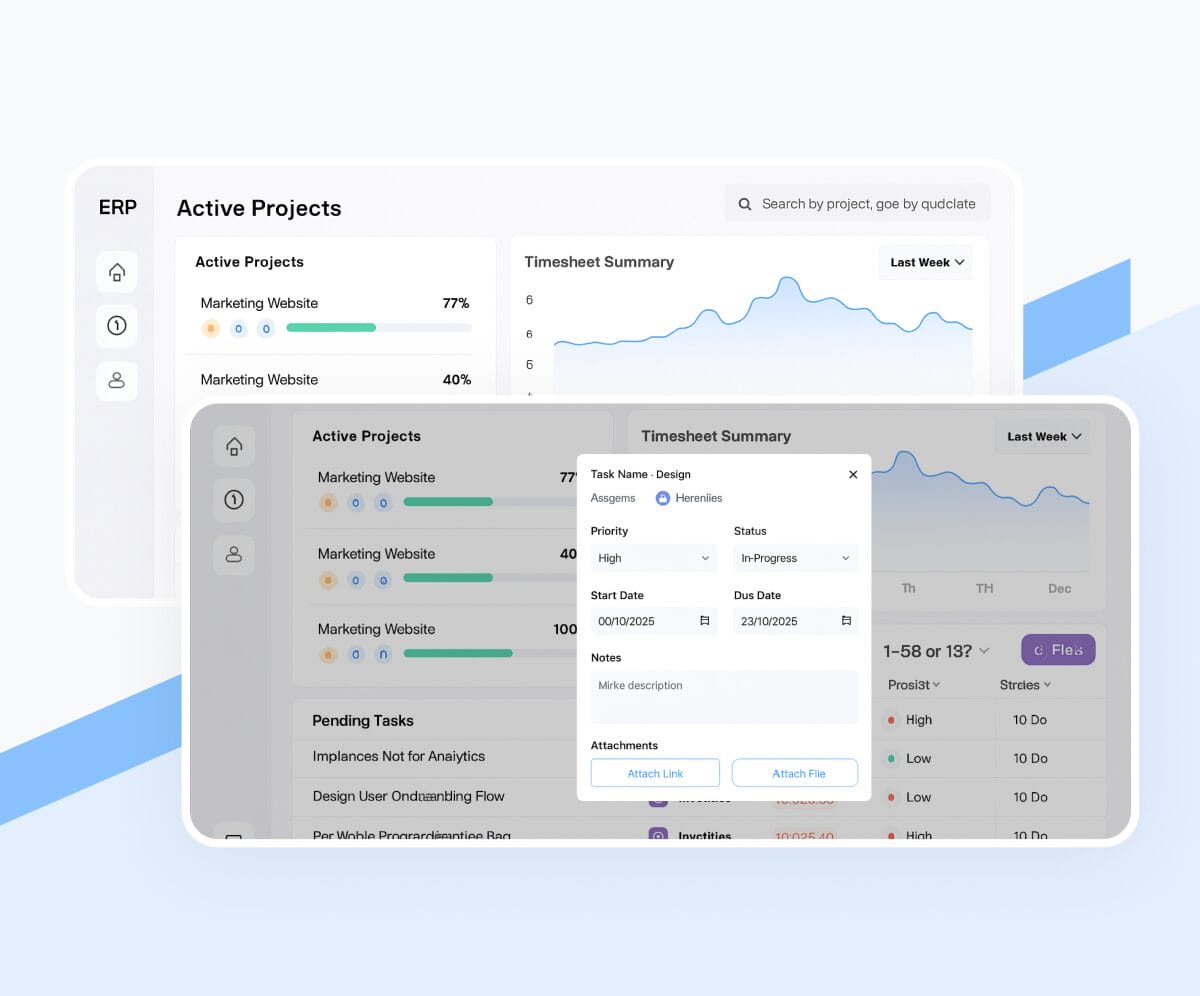
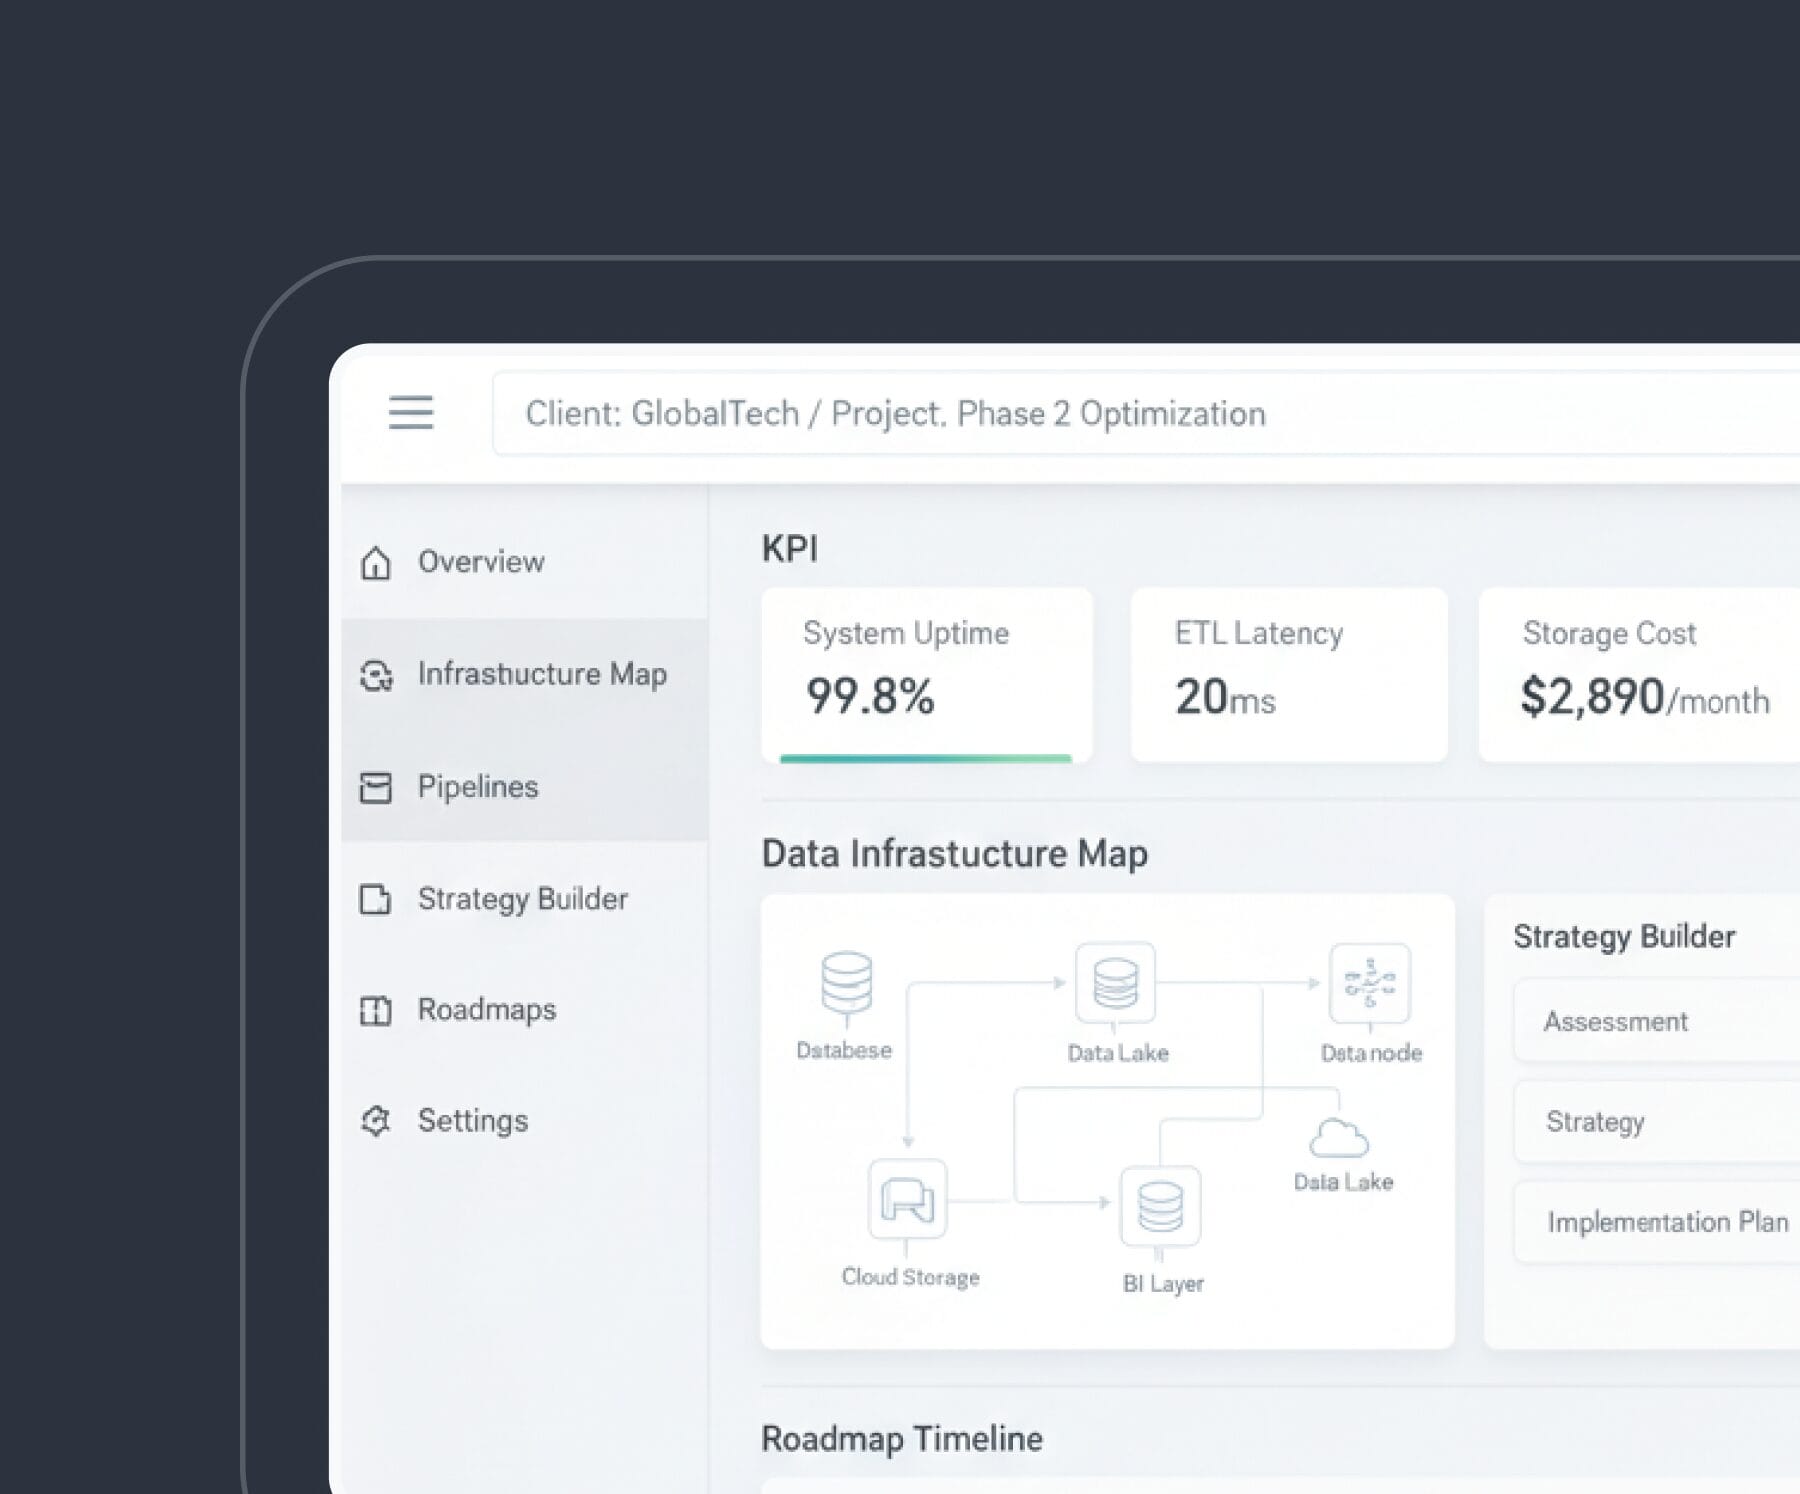
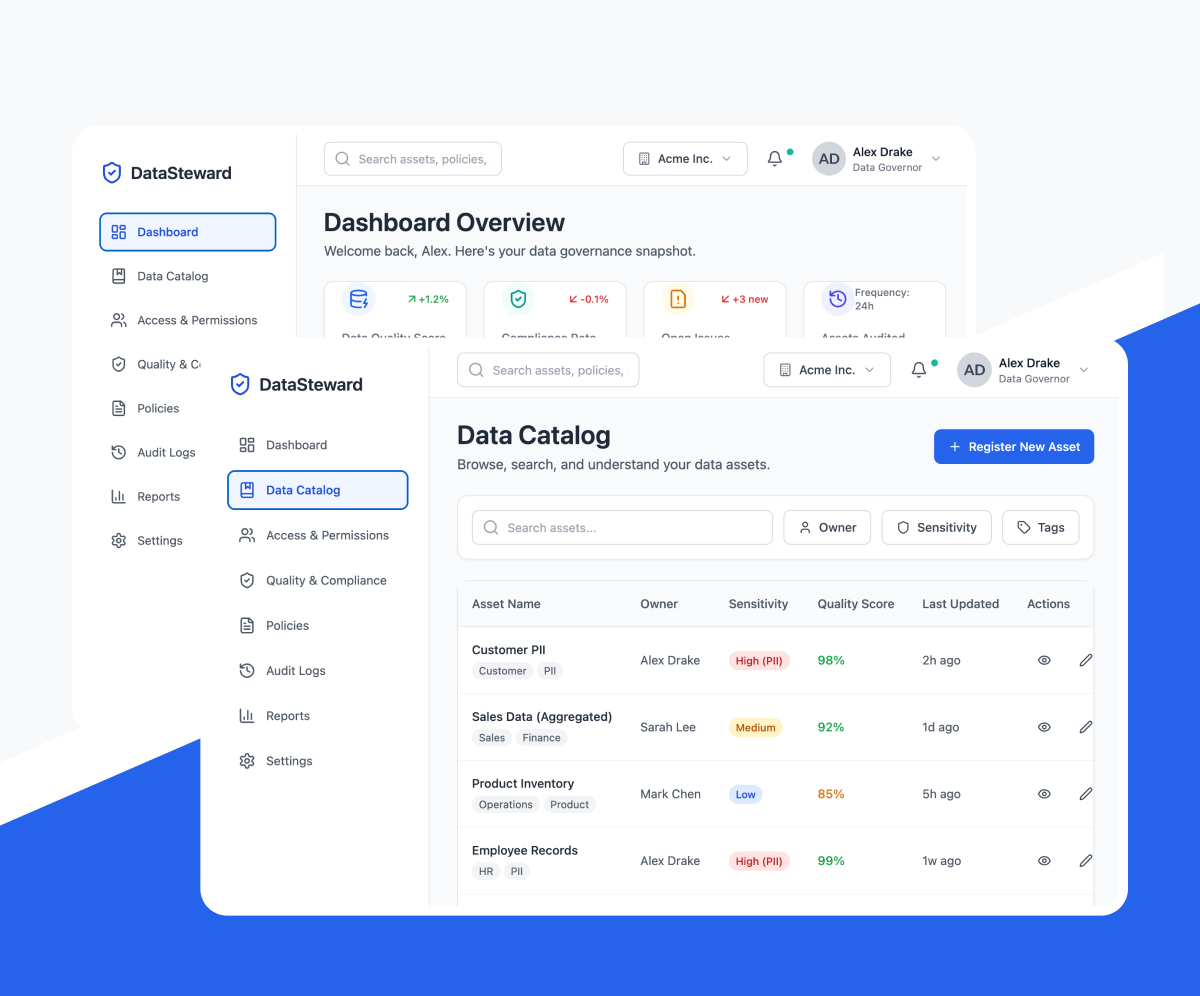
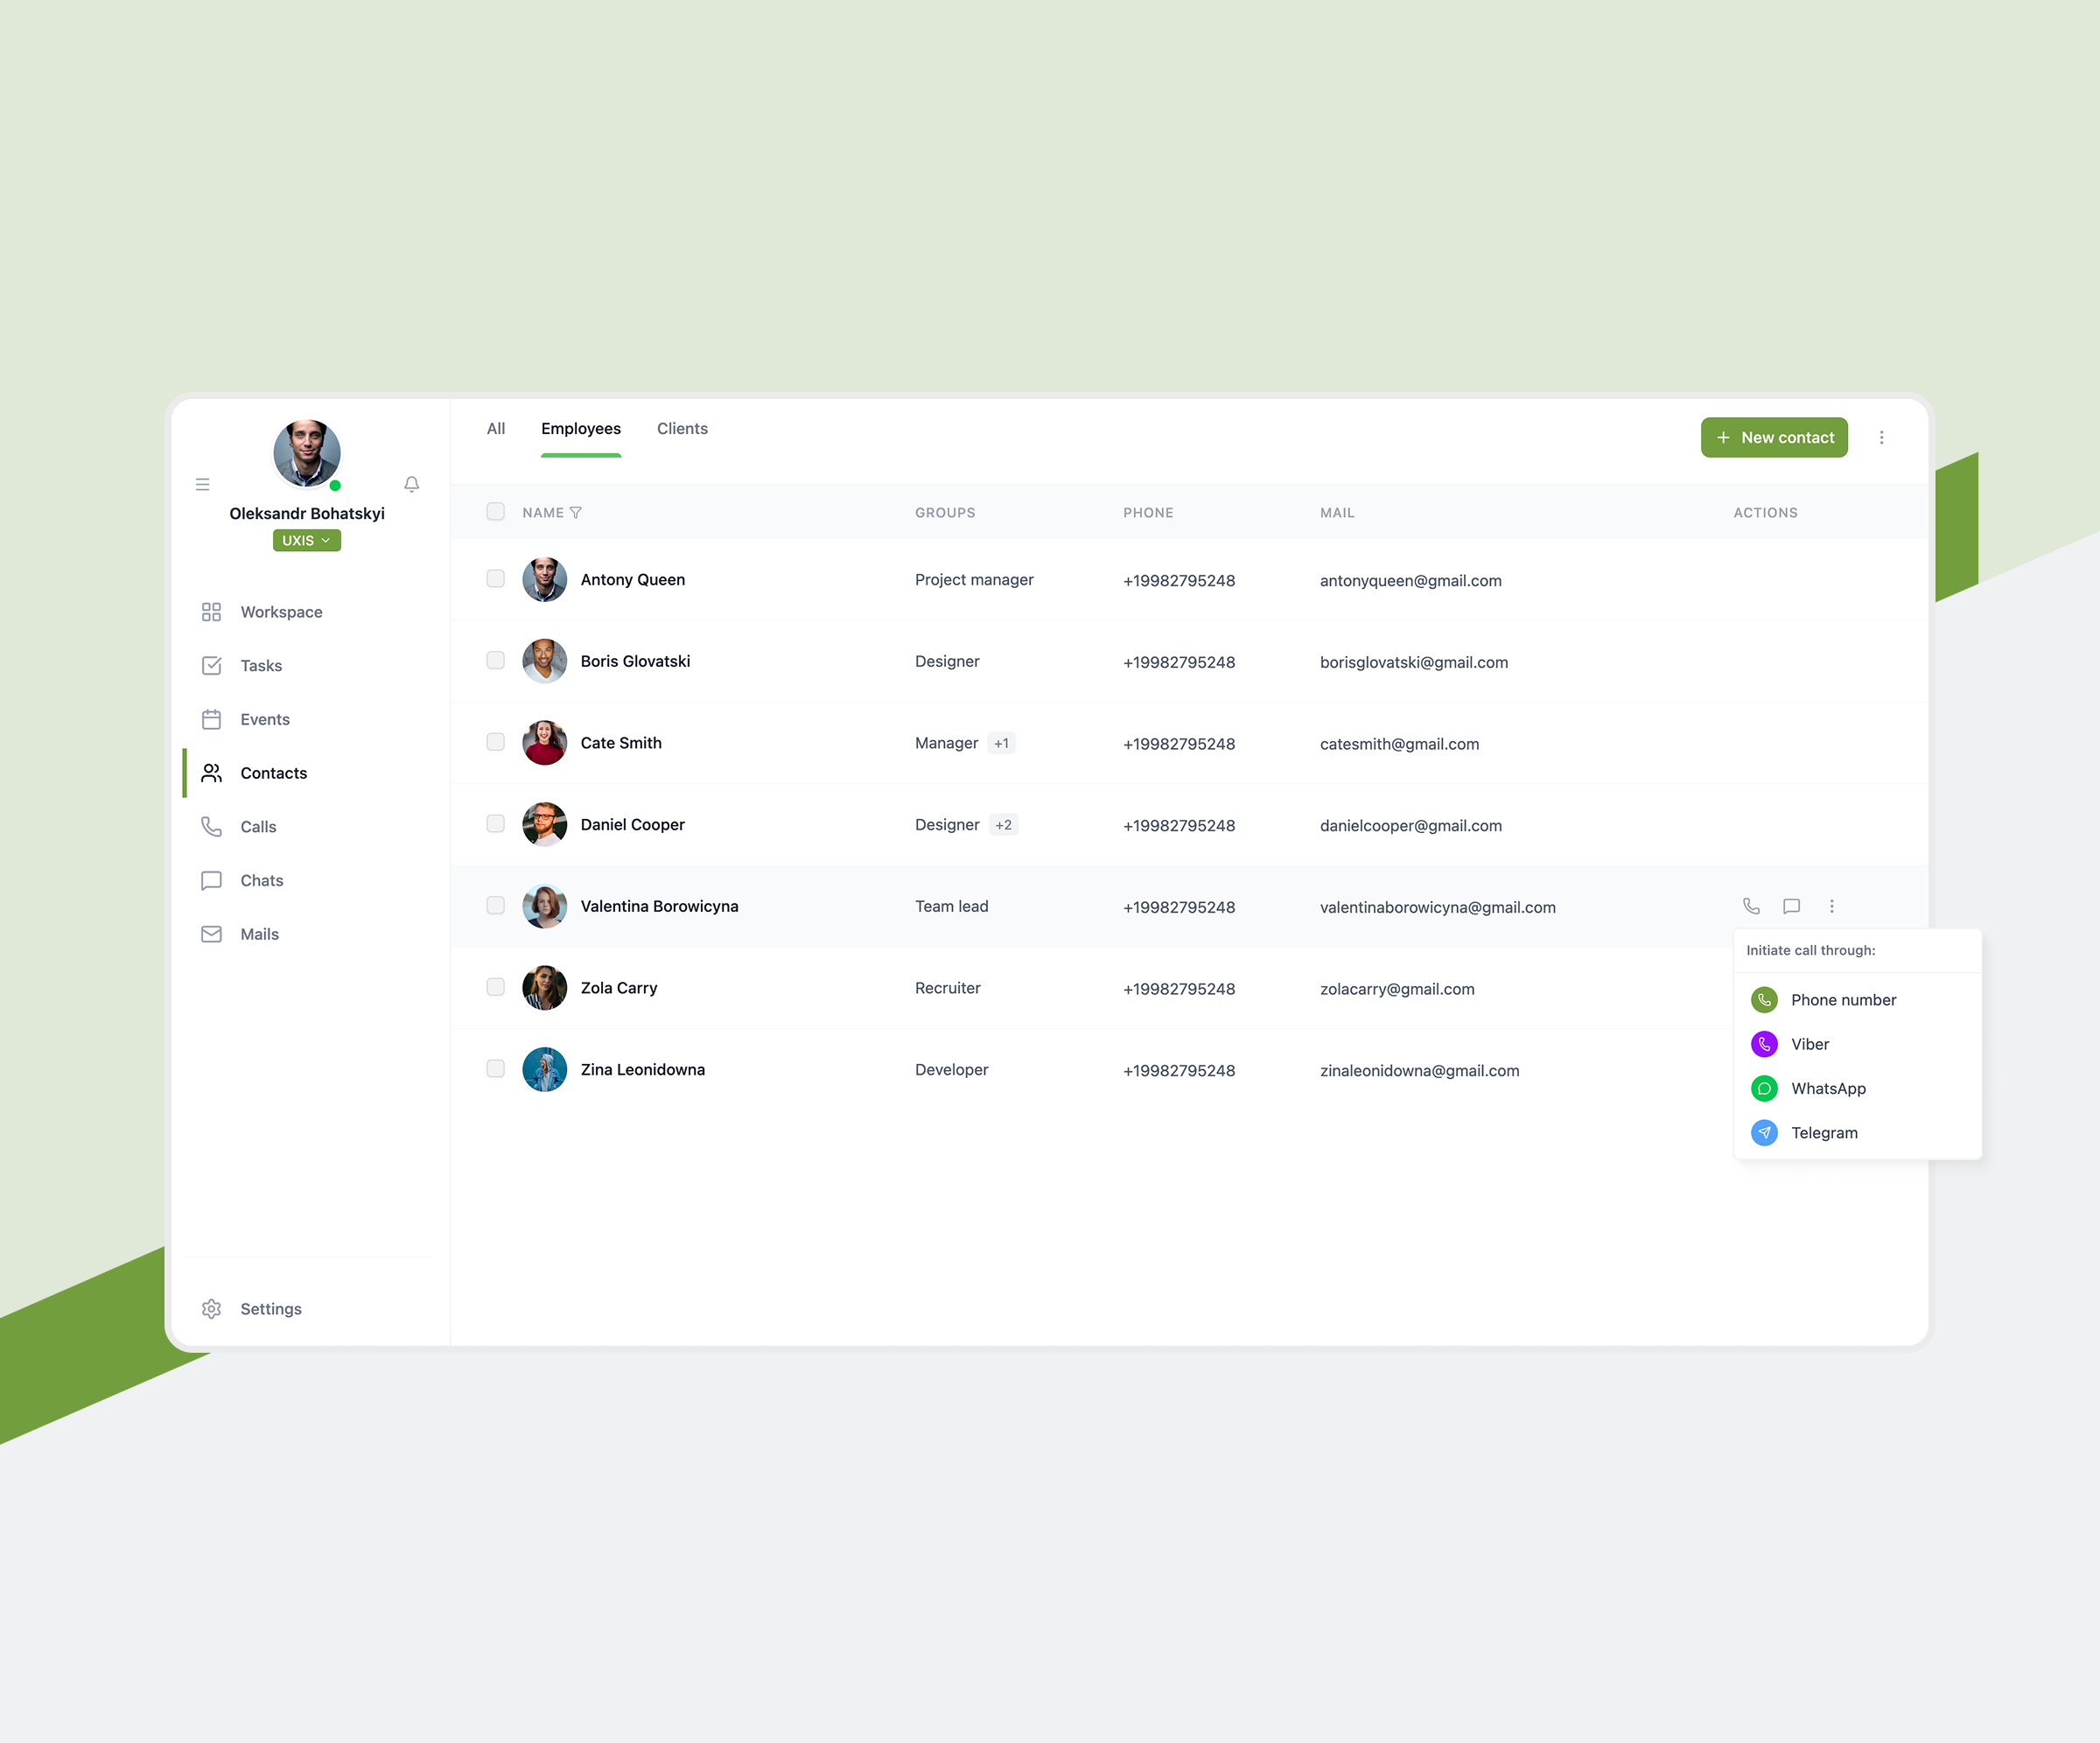
Custom Data Visualization Solutions by Elinext

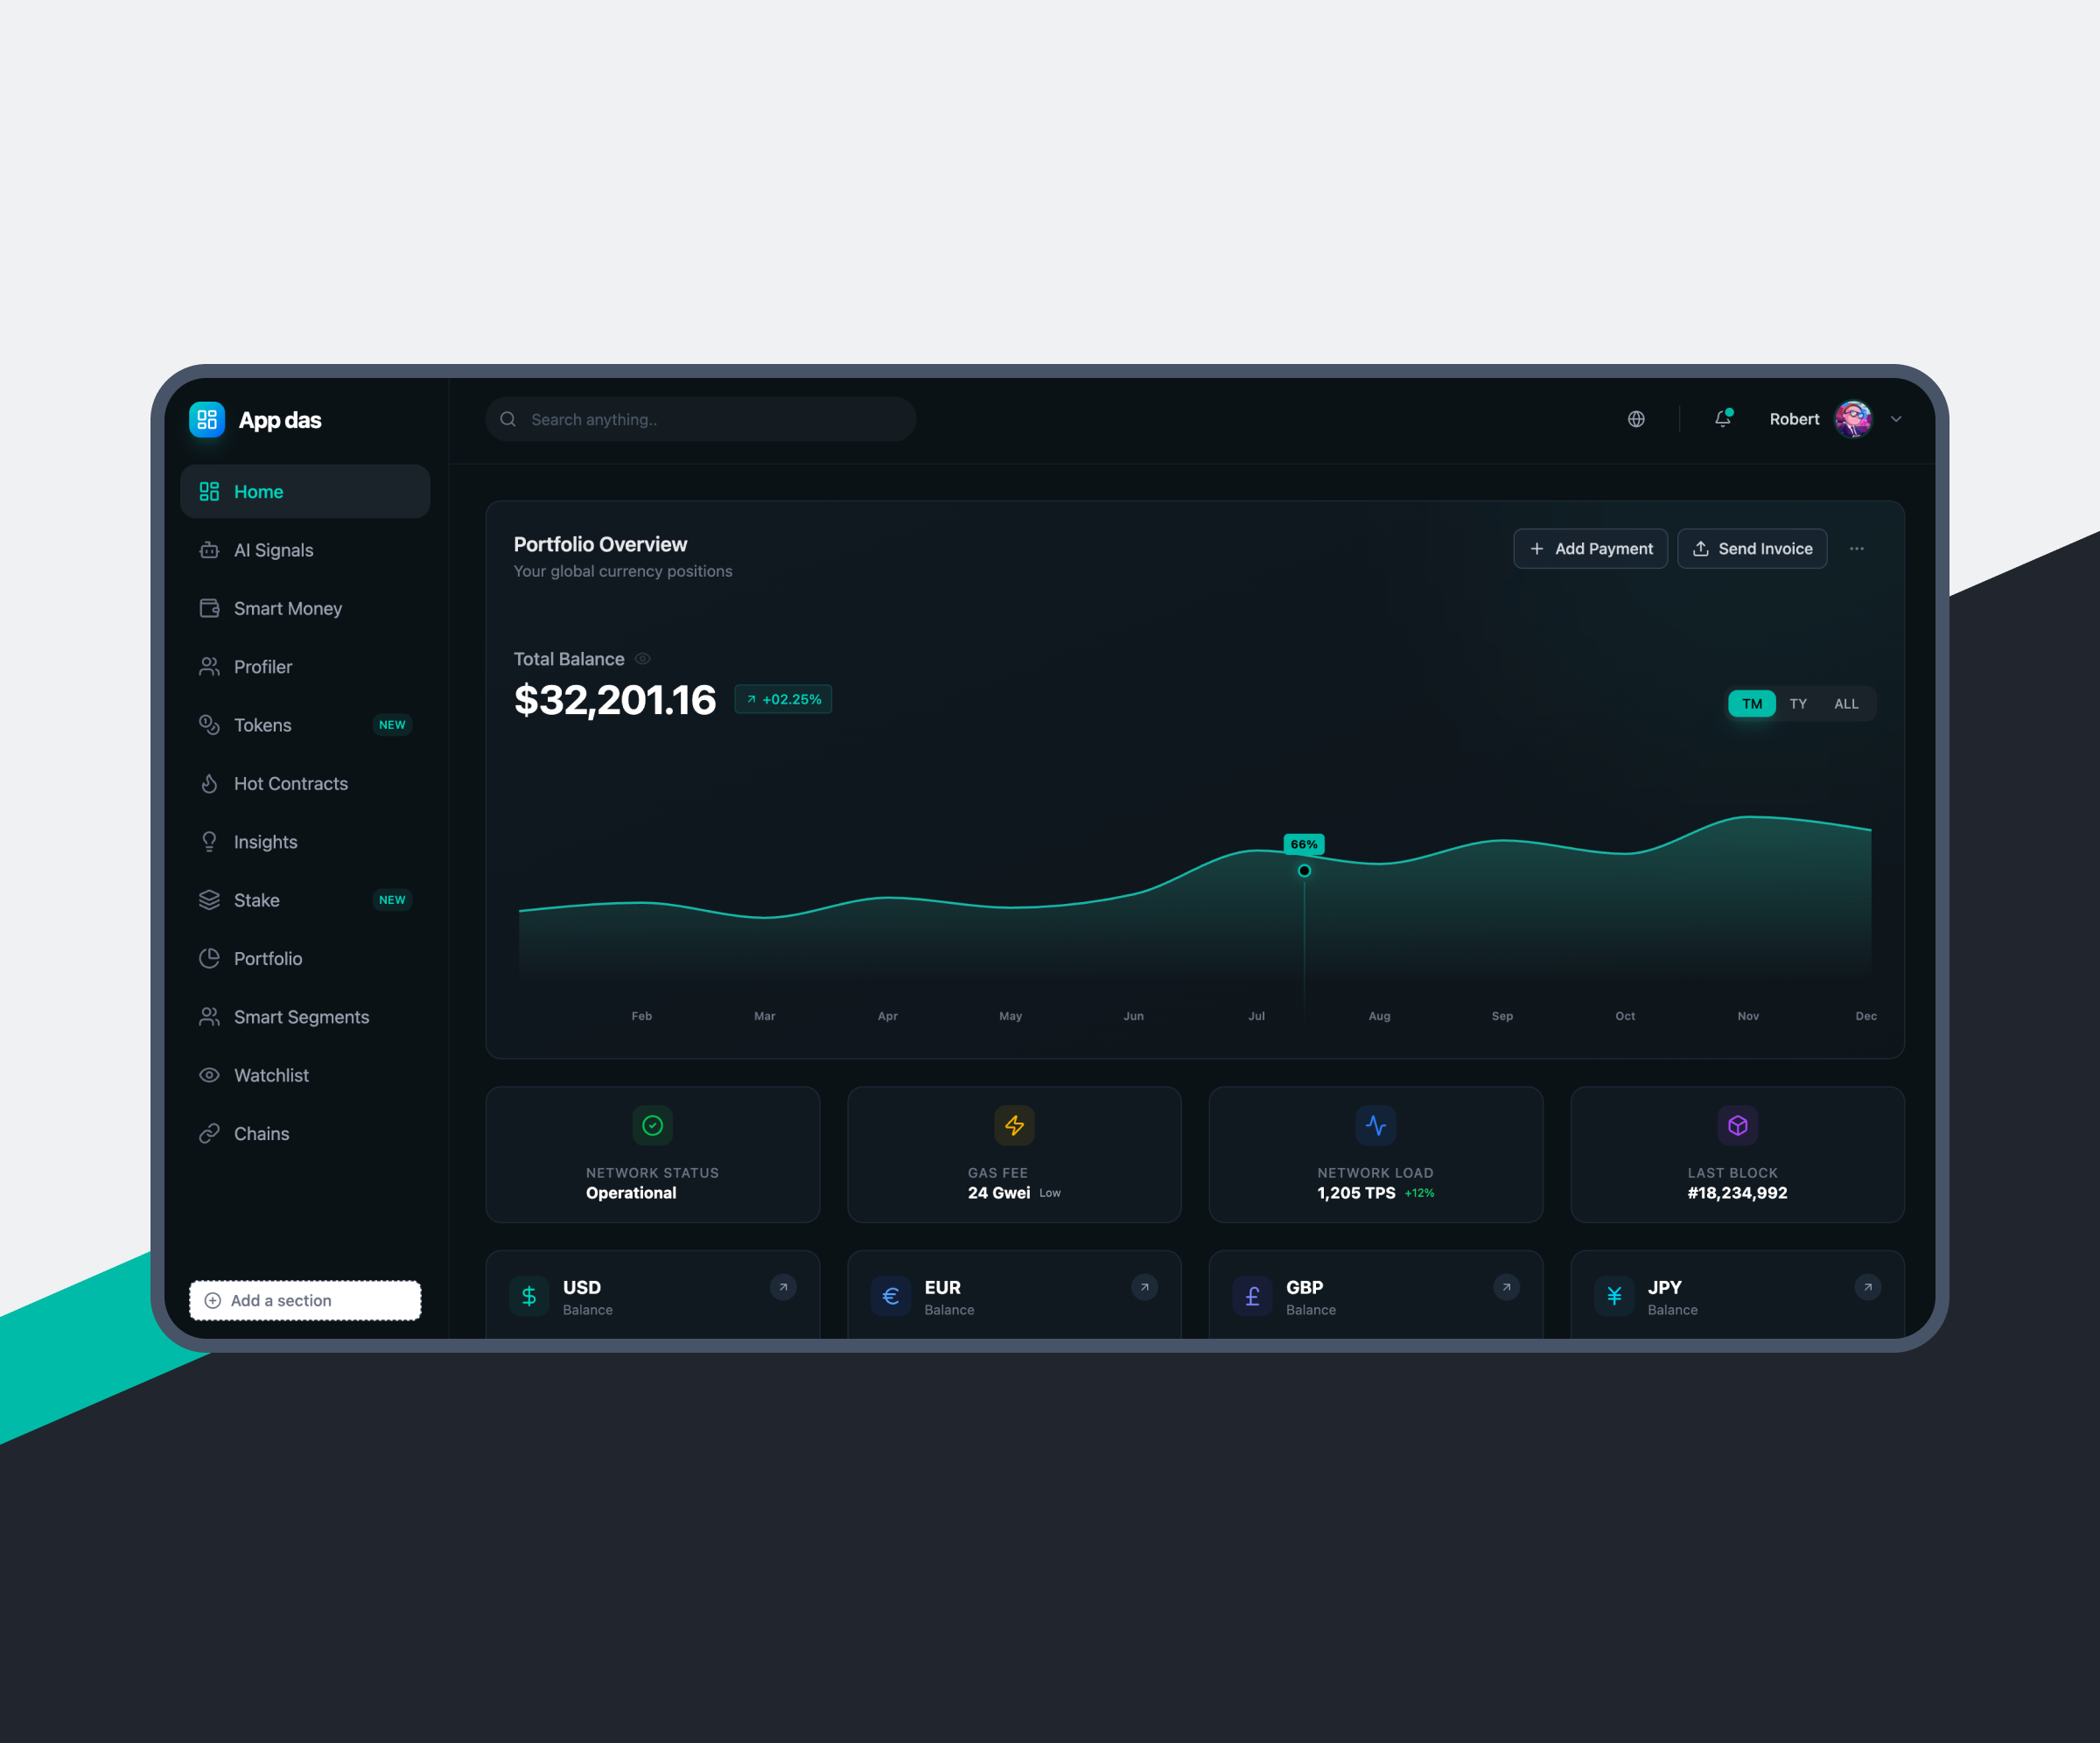
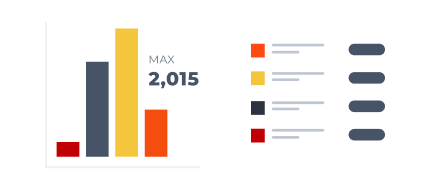
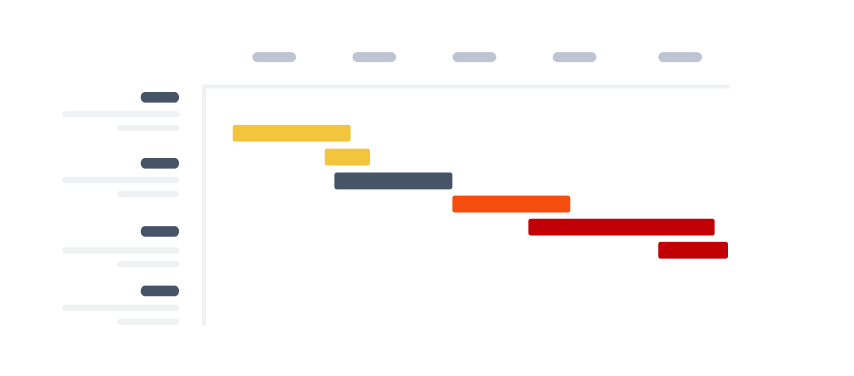
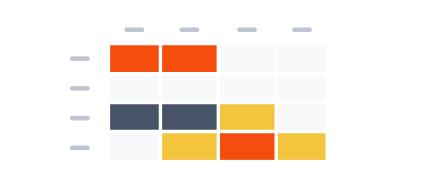
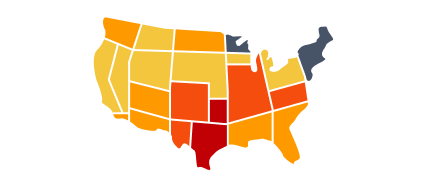
Our Data Visualization Methods and Techniques
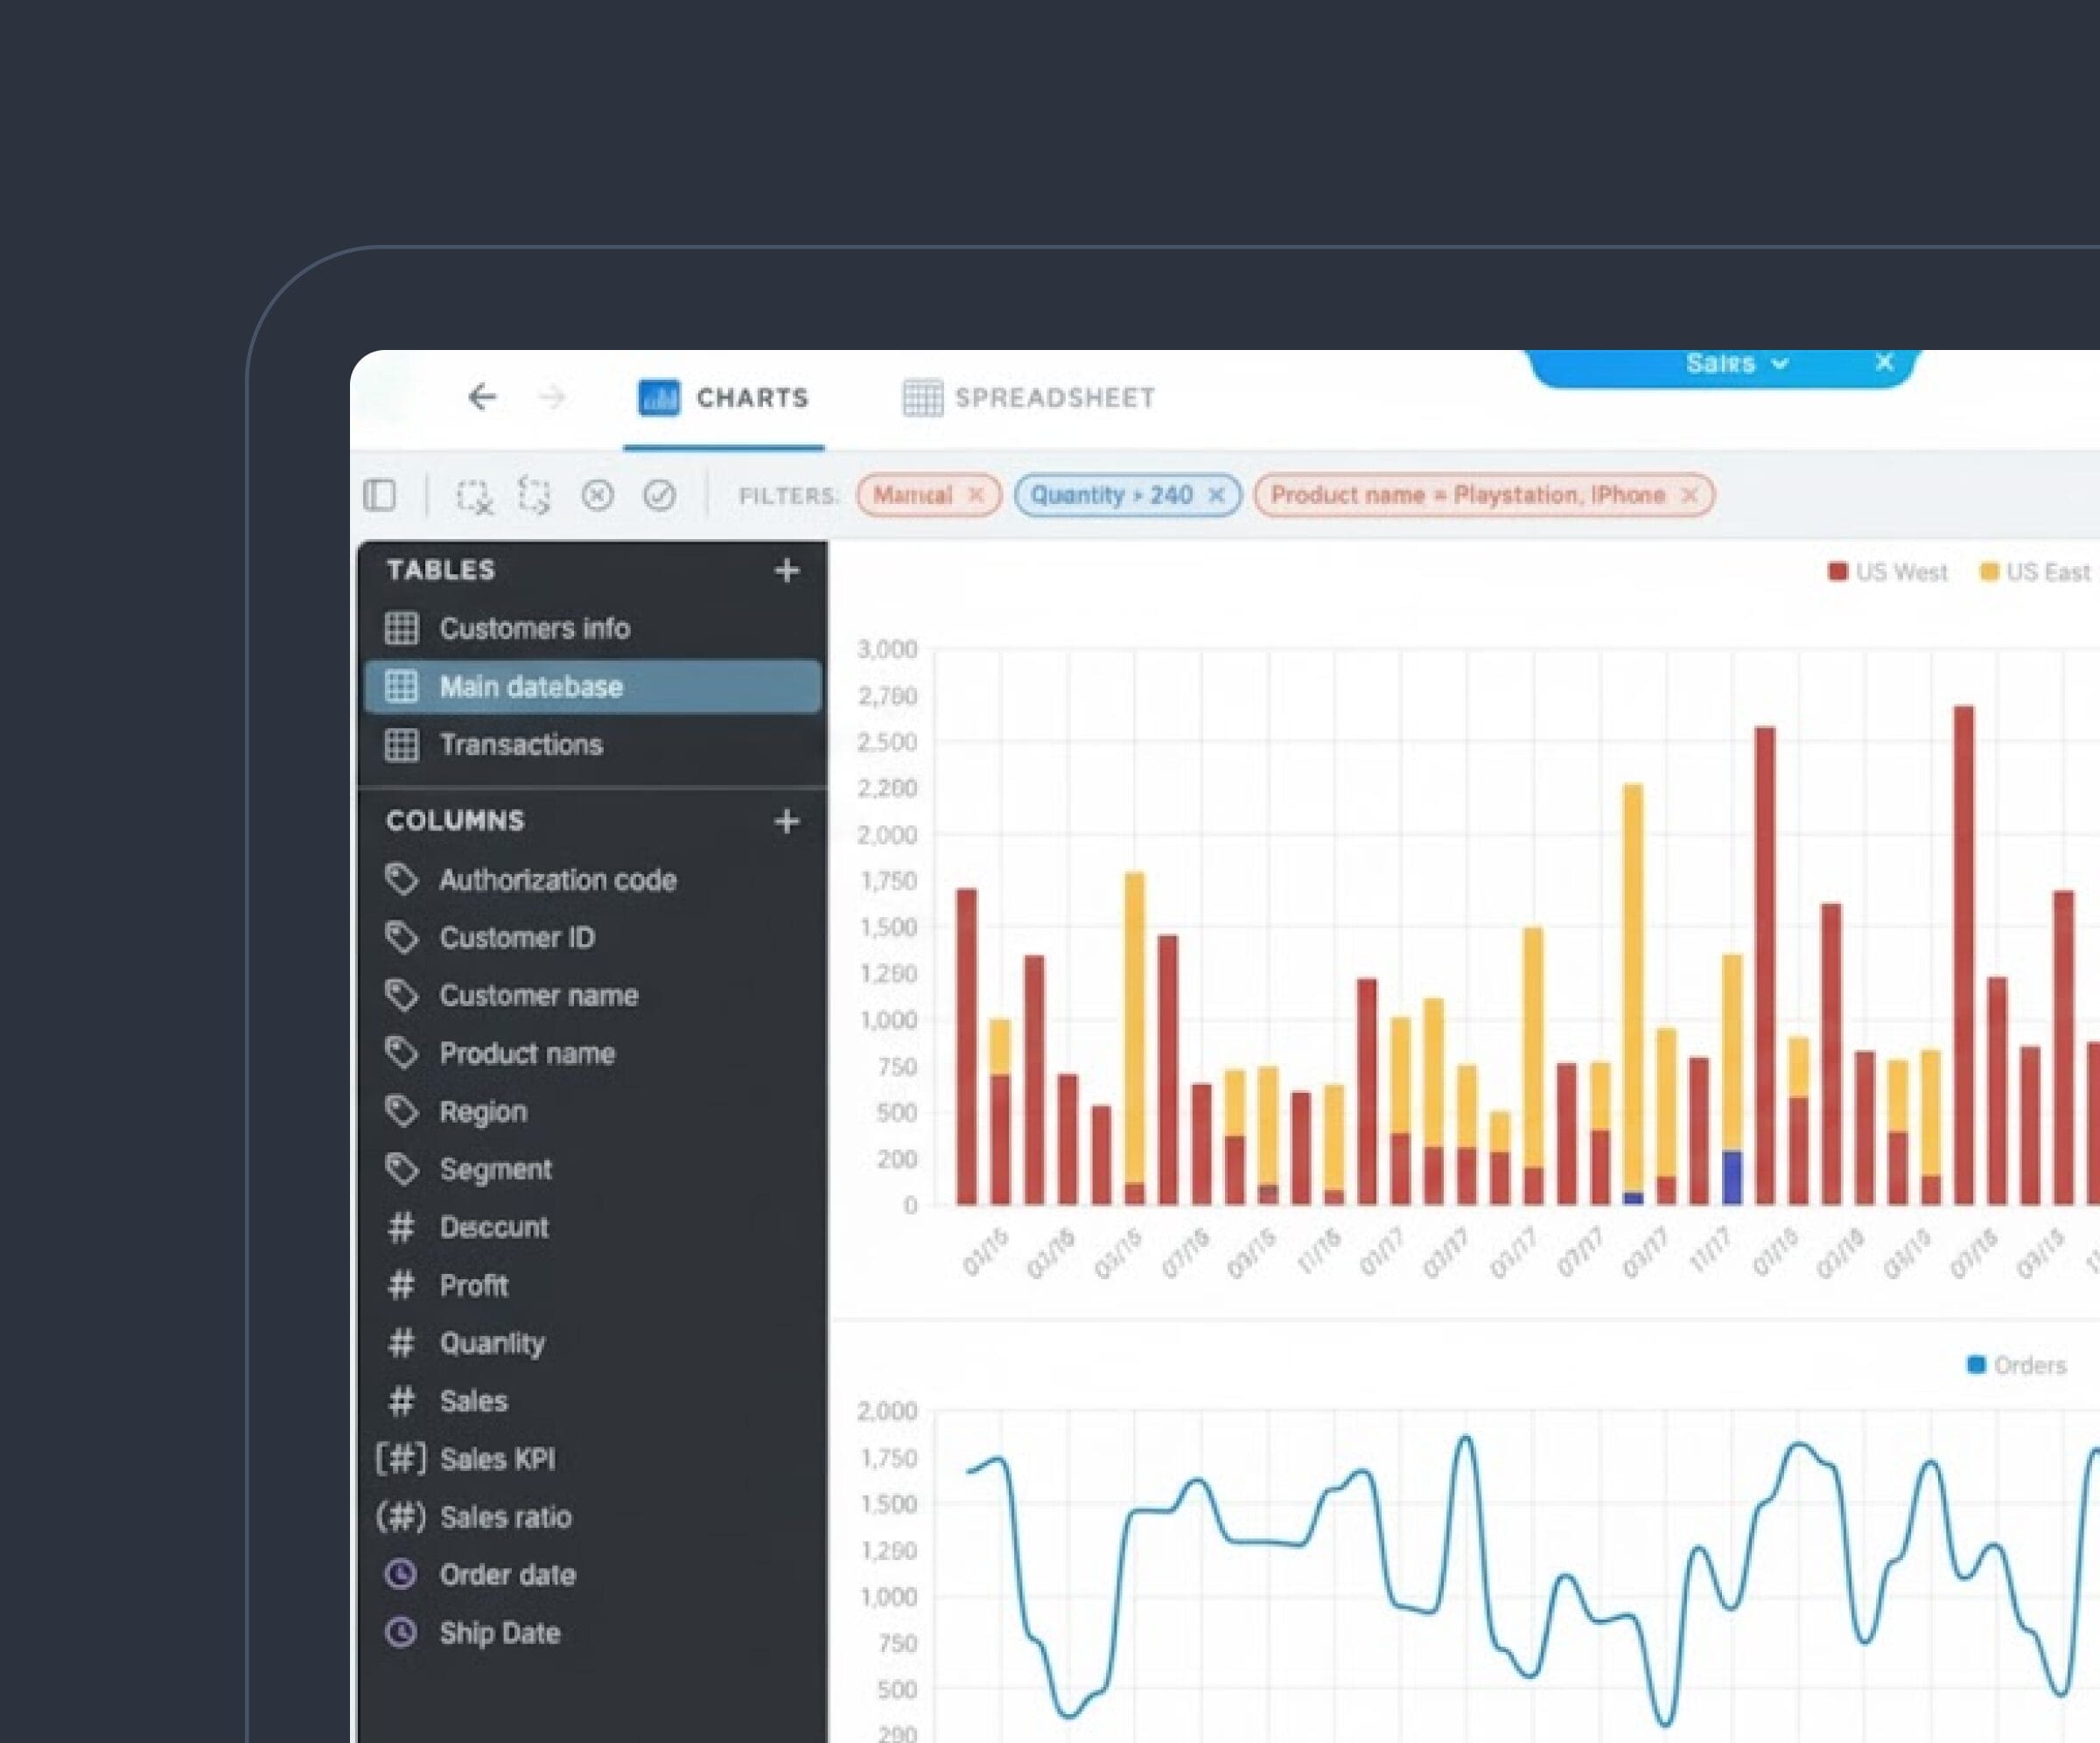
From charts and histograms to maps and matrices, our data teams use a wide array of data visualization techniques to make data work for your good.
Our Holistic Offer of Data Services
What Our Experts SayWhat Our Experts Say


Industries We Serve
Explore the industries Elinext serves with its high-end analytics and data visualization solutions.


Explore the industries Elinext serves with its high-end analytics and data visualization solutions.
Core Technologies We Work with
-
Data visualization 12+0
-
-
Languages 12+0
Practice28 yearsProjects400+Workforce80+Most popular web programming language enabling interactive apps, dynamic websites, and enterprise-scale platforms globally.
-
-
JavaScript frameworks 12+0
Practice7 yearsProjects20+Workforce15+Progressive front-end framework enabling developers to build scalable, lightweight, and maintainable apps globally.
-
-
Data storage 12+0
-
-
Clouds 12+0
Practice13 yearsProjects30+Workforce10+Largest cloud provider offering compute, storage, AI, and analytics with unmatched scale, global infrastructure, and millions of customers.
Practice12 yearsProjects10+Workforce10+Cloud platform uniting AI, data, and IoT with hybrid support, strong security, and 60+ global regions for enterprise scalability.
Practice12 yearsProjects20+Workforce15+Cloud platform with strong AI, data analytics, and open-source tools enabling business innovation at scale across 200+ countries.
-
-
Big data 12+0
-
The Benefits of
Data Visualization Solutions by Elinext

Choose your
Service Option
Hire Data Visualization Experts
from Elinext


Why Elinext?
Listen to Our Clients


Looking for Related Services?
FAQ
-
Yes, Elinext can integrate data analytics and visualization solutions with your existing IT systems. Depending on the industry you operate in, it can be SCADA or MDM systems, ERP, core banking systems, QMS software, etc.
-
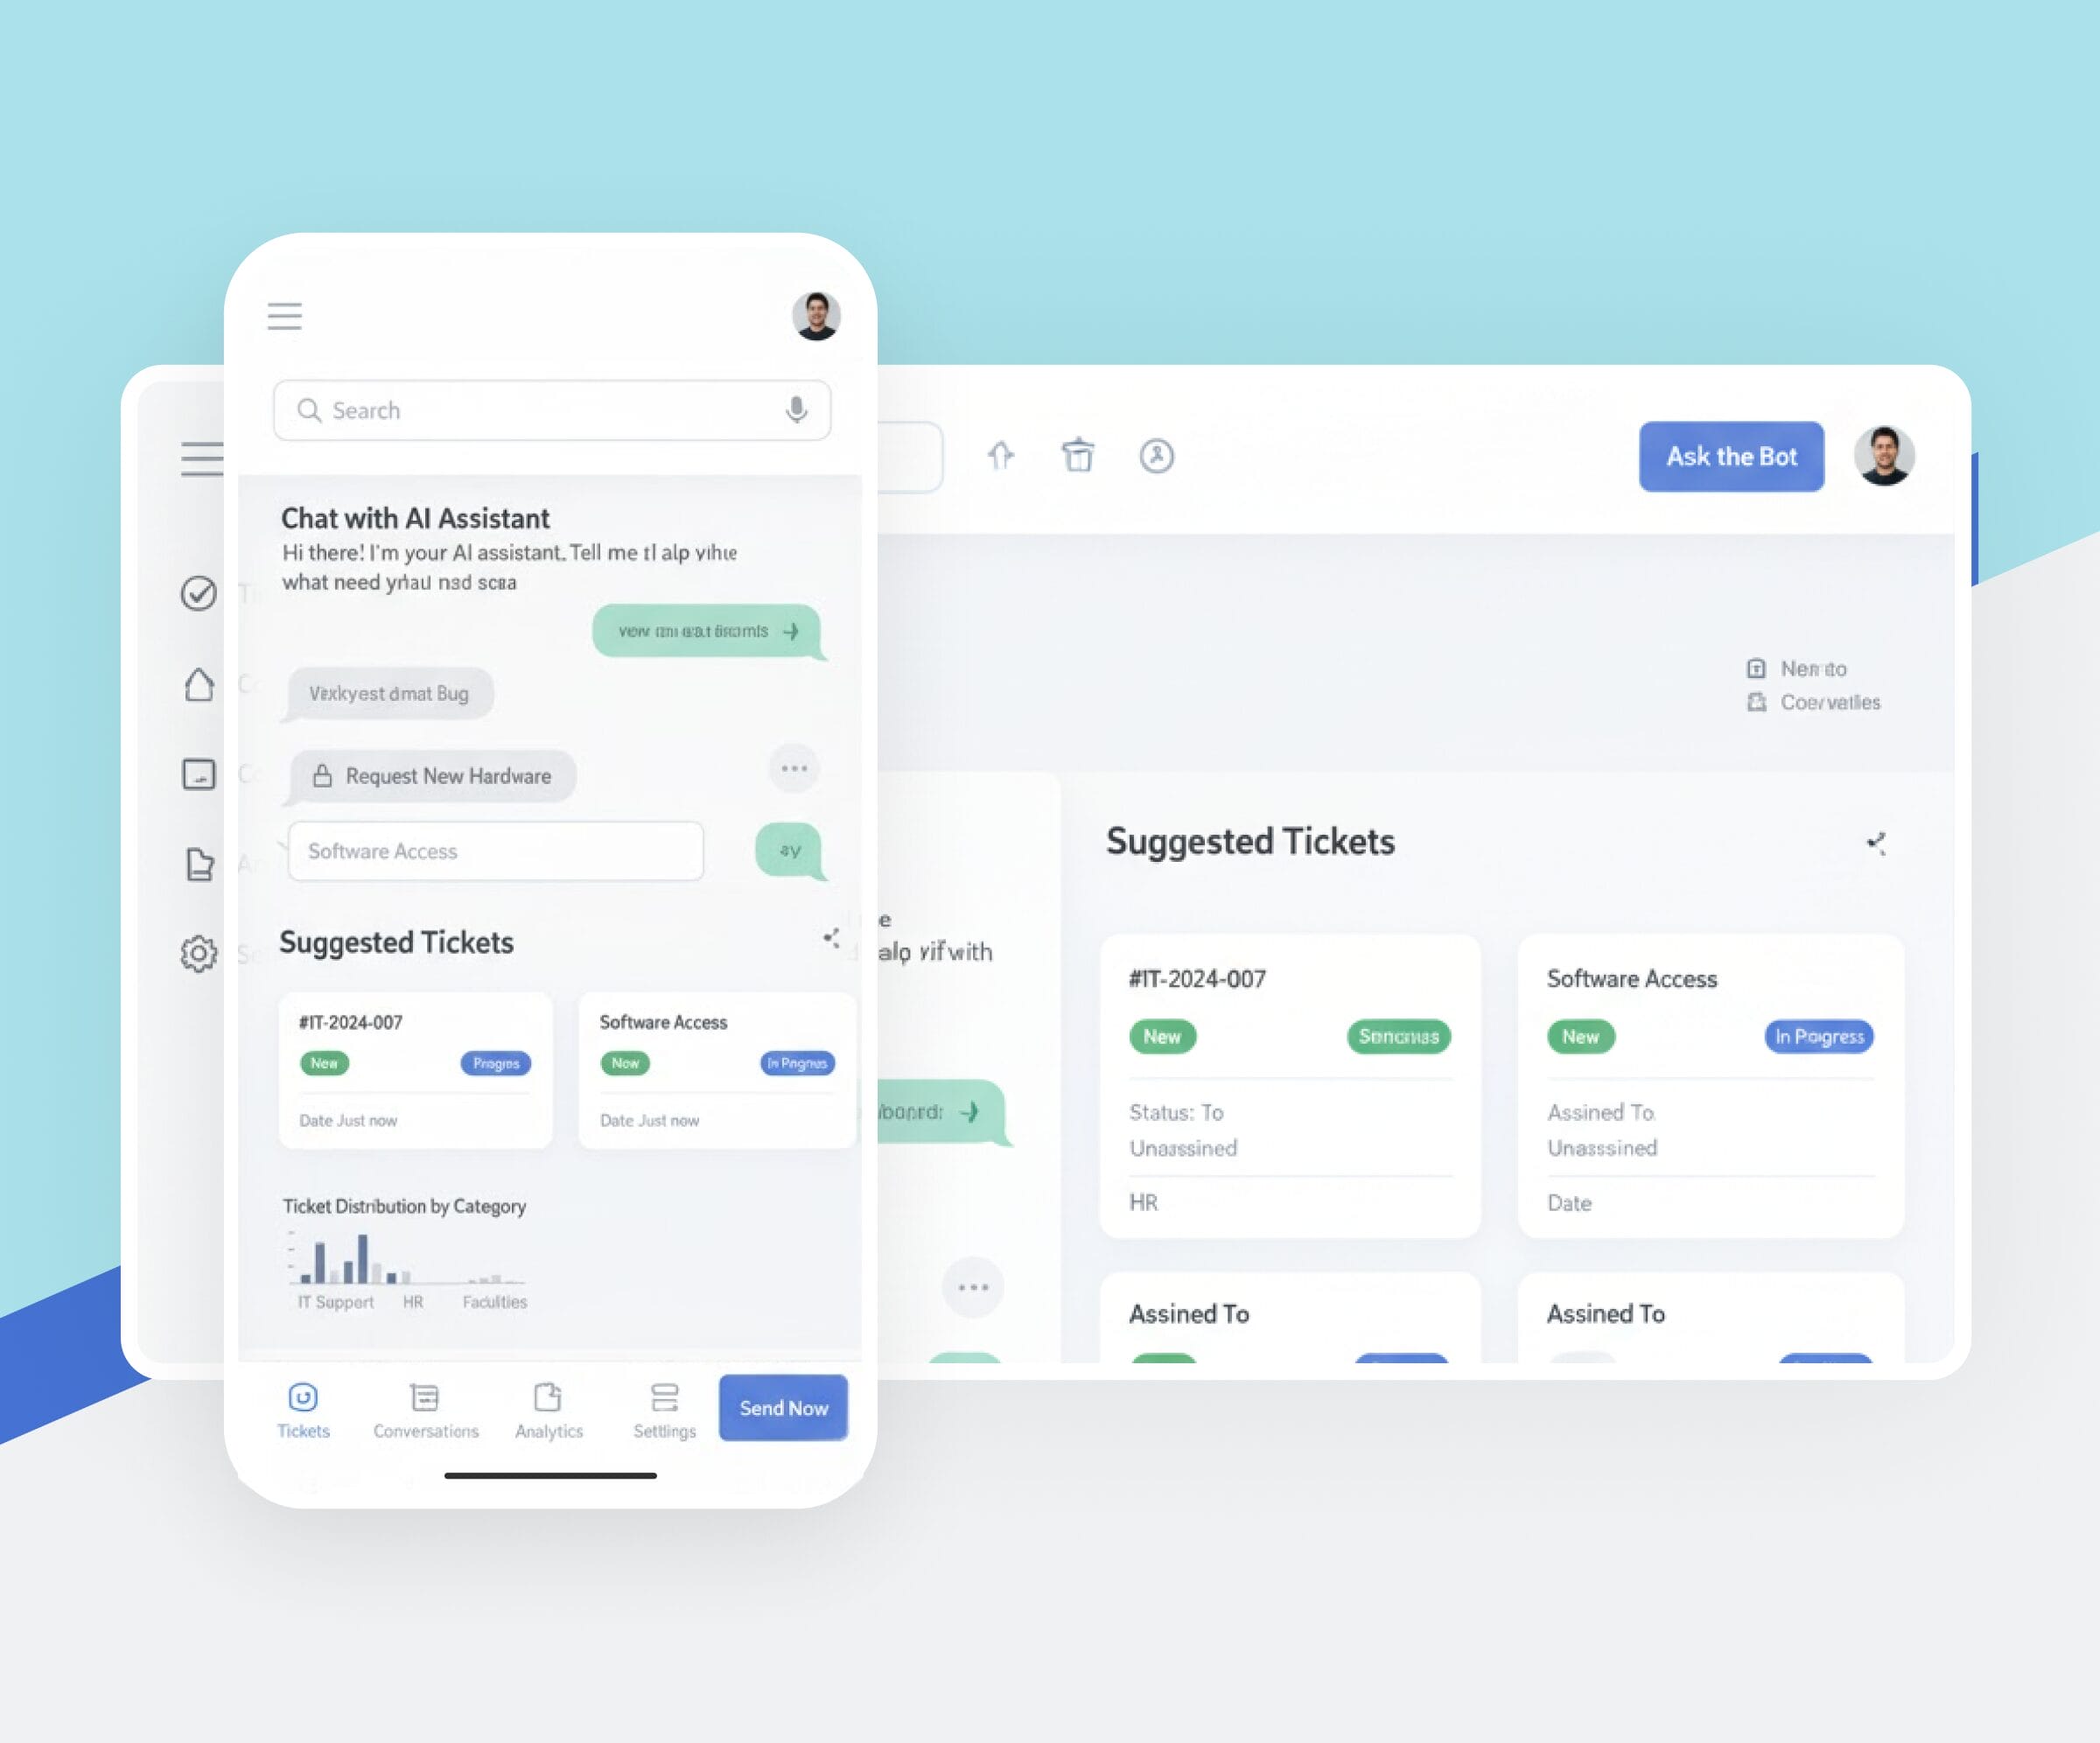
Yes, our data team can develop custom data visualization tools that offer immediate insights presented in easy-to-read charts, slideshows, graphs, etc. Real-time data visualization is particularly critical for businesses in healthcare, finance and manufacturing.
-
The investment required to complete a data visualization project depends on such factors as system complexity, engineers’ seniority level, and other variables, typically ranging from $60,000 to $800,000.
-
The duration to develop a BI solution with visualization capabilities can range somewhere between 3 months to one year or even more depending on the business problems that need to be solved.
-
Data visualization has a strong interconnection with business analytics. Business analytics implies dealing with business data to extract specific insights, while visualization presents these insights in a convenient, visual format.

Data Visualization
Articles Data Visualization
Articles
Articles
Articles


