


Client
This is a non-commercial showcase made specifically to demonstrate our expertise in machine learning and solving complex software development problems.
Challenge
Retailers often struggle to optimize their stocks. Stockpile too much of a good, and you’re leaving no room for storing another. Buy too little, and you risk sending your customers to your competitors.
We noticed the market was increasingly trying to solve that problem using predictive analytics and were curious if we could provide such a solution. But predictive analytics in this case required separate sales data for different goods, something you can’t easily find in open source tools.
“Forecasting retail demand requires sales data per good, something you can’t easily find in open sources.”
Elinext had no experience in predictive analytics in retail. Therefore, we set out to model a case to learn the specifics of the sector.
Process
Our team included two machine learning (ML) engineers. We had experience with AI and projects where essential data wasn’t easily available, but we’d never built ML models specifically for retail before.
So, the team faced two major challenges: lack of data and the lack of specific experience. Here's how we addressed these challenges.
Sourcing the Data
We began solving the data problem with research. Retailers wouldn’t willingly share their precious information with us, and the studies we found didn’t provide specific insights. But we soon realized there could be a place to find useful numbers: programming competition reports.
Our search led us to M5 Forecasting Accuracy 2020, one of the Makridakis Competitions. Well-known to developers since 1982, the challenge is held by the University of Nicosia and Kaggle, an online community of data scientists and ML practitioners.
“We found useful retail data from Walmart with the M5 Forecasting Accuracy Competition.”
The original M5 Accuracy competition involved 5,500 participants who studied data for more than 30,000 goods provided by Walmart. The very fact that a large retailer provided such comprehensive data for experiments with AI made it a singular source of knowledge.
And that’s what made it the perfect case study for us to take a cue from.
Selecting the Development Framework
Elinext didn’t have previous experience in building predictive analytics for retail. Therefore, we started by analyzing the approaches that proved most successful through the competition. That’s a sure way to avoid repeating predecessors’ mistakes and cut the development time, compared to working from the ground up.
We found reviews of some of those approaches, which was good for a starter. Unfortunately, the reviews lacked a lot of essential details. Only a few descriptions came along with the code, and those didn’t include the top competition performers.
“We started by analyzing the approaches that proved most successful.”
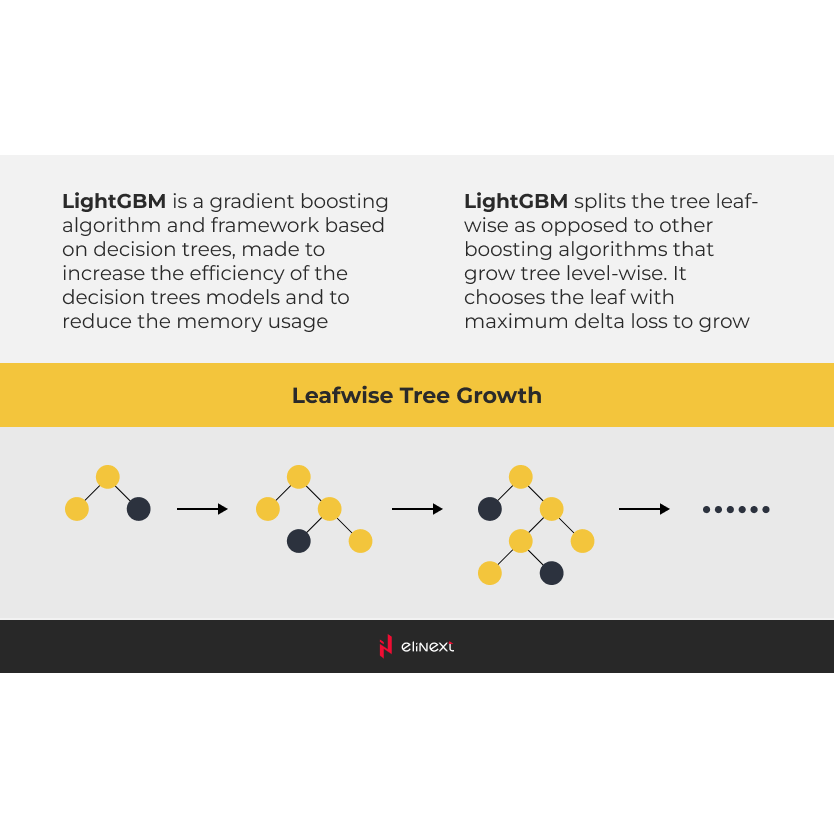
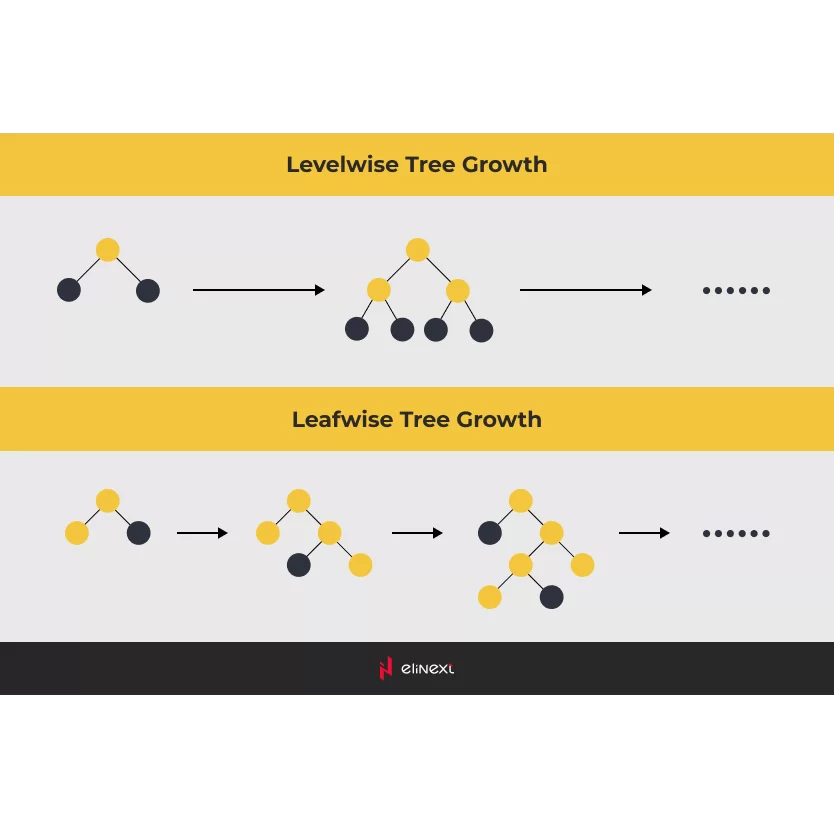
Nevertheless, we dug into the winning approaches and made an important discovery: decision trees outperformed neural networks. To be more specific, winners referred to gradient boosting machines (GBMs). Among those, LightGBM had proven itself as the best framework to build an ML model for the task.
Product
Outlining the Training Dataset
The data we found with the competition, although useful, represented a challenge in itself.
First of all, about 60% of the records were zero. That made the data difficult to use with standard analytical methods for capturing dependencies. Data like that was chosen to push competitors to go beyond practical applications and contribute to the development of theoretical methods.
Datasets with so many gaps affect the potential prediction accuracy. We didn’t know whether those zero records were due to low demand or gaps in supply. And it remained anyone’s guess as to how those zeros related to demand observations from other days.
However, the approaches proven successful through the competition can yield amazing results when applied to more comprehensive, complete datasets.
Second, the given dataset was huge and spread across multiple aggregation levels.
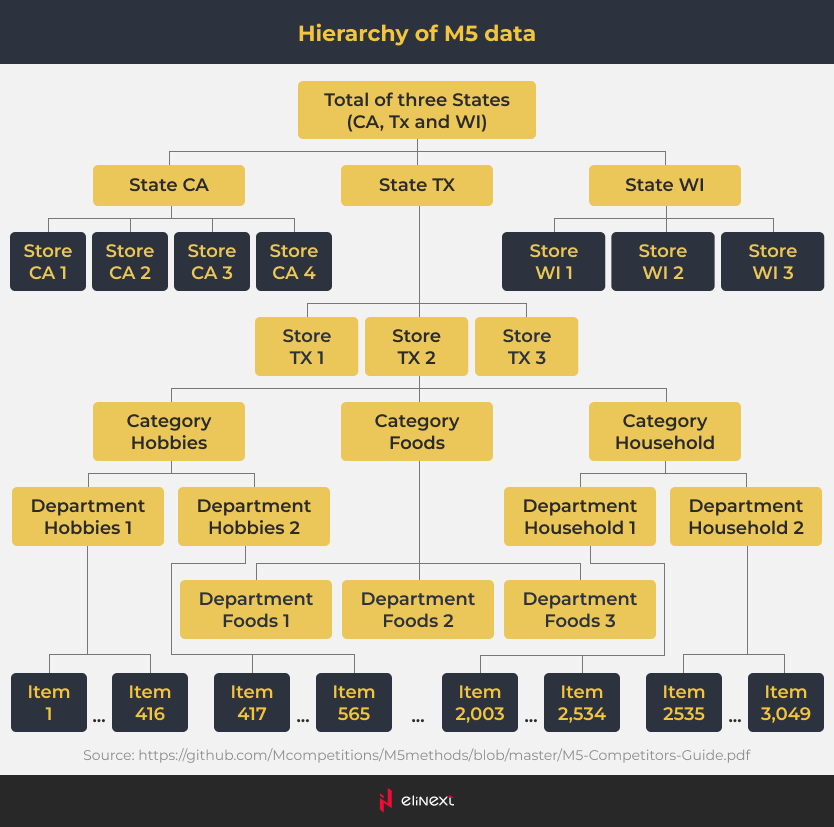
We found sales data for each of 3049 goods from 10 stores across 3 states (California, Texas and Wisconsin) for 28 days. The data was also grouped by category (food, household and hobbies) and department (e.g. Food 1, Food 2). In addition, the factors included advertising and promotional activity, events like holidays, days of the week and more.
As a result, the dataset involved 42,840-time series. And that made it close to real-life situations, where retailers operate using thousands of products. By modeling a large number of time series simultaneously and within a reasonable timeframe, the competitors created a practical, useful approach.
“The dataset involved 42,840 time series for 3049 goods from 10 stores across 3 states during 28 days.”
Building the Machine Learning Model
We followed the approach rooted in LightGBM, using our own model configuration and sets of features. Those features included close to 30 factors, such as lagged sales values, seasonal effects, price, and more. Many of them were used by competition participants as suggested by the very nature of the project.
We found out that lagged sales values and product IDs had the most influence over the results in our model. Every product ID referred to a particular series, which made the model calculate sales dynamic specifics for each product.
Seeking to create a model applicable to real life, we tried to calculate what accuracy one could actually achieve with the available dataset. Here’s what we did.
We selected around 20 time series almost without zeros. These products belonged to the food category. So, we avoided the main dataset complexity (zeros), and also can reasonably assume that the series follow more predictable patterns than other goods categories. Food sales cycles are shorter, their reactions on calendar effects are more obvious, etc. Thus, we think that the prediction power of any modeling approach achievable on this data subset should be higher than on the whole dataset. This data is our golden standard for the whole dataset.
We modeled this data subset with a very conventional statistical approach, ARIMA. LightGBM is much more efficient, at least in processing time, to use for large datasets. But, for a small one, ARIMA was enough to quickly reveal the truth. For most of the series we made models that satisfied all the conventions of time series analysis, including white noise error terms. So, the whole pattern depends on variable dynamics, in our case it is daily sales, which is then covered by the model. The white noise is a purely unpredictable process. We cannot model it. We conclude that a series covered by a model cannot be modeled better with any alternative. We can use these series as a golden standard for our dataset. On these series, the best forecasting accuracy in absolute terms we achieved didn’t rise substantially above 70%. So, for the whole dataset (here we can just assume), it probably can’t jump higher with any approach.
We can’t expect impressive, absolute accuracy from the M5 competition data, although the situation can be different for other retail datasets. The modeling process is data-dependent. It should reveal business data generation processes behind an actual dataset.
But for this particular dataset, we can measure our modeling skills in relative terms, comparing them with the leaders’ results.
Results
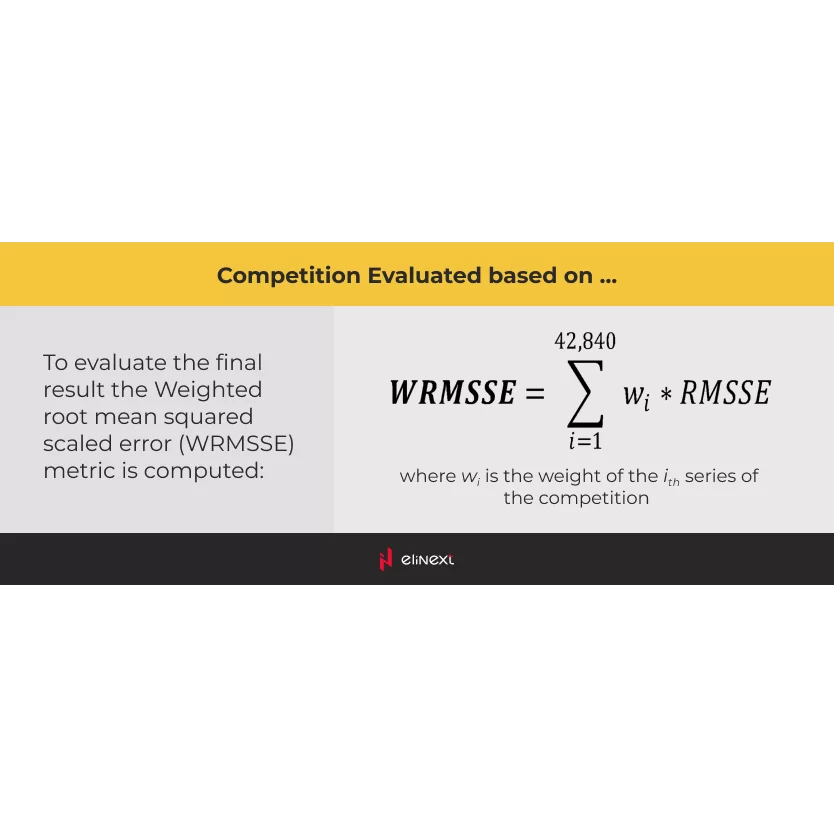
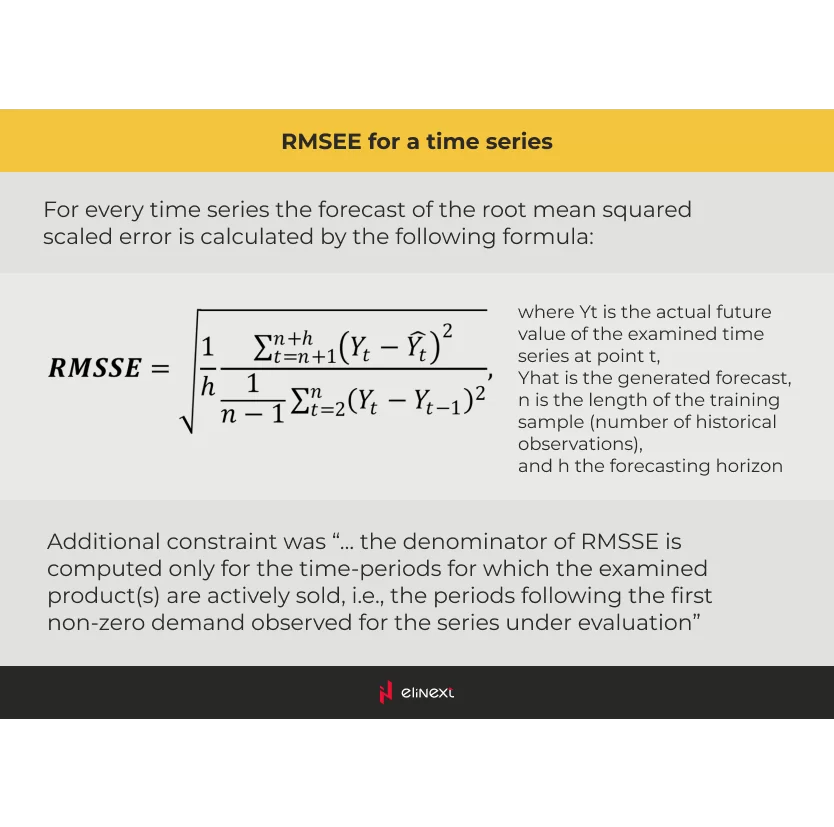
The competition organizers ranked competitors based on the weighted root mean squared scaled error (WRMSSE) rate. The lower the rate, the better the developer did. We scored 0.54, which put us in the top ten of 5,500 competitors.
But the algorithm we built can be used beyond forecasting demand. It can uncover interdependencies between multiple factors, invisible to an untrained eye. Retailers can use those interdependencies to better plan their budgets and make sure goods end up in customers’ corbs sooner rather than later.
“Elinext achieved a prediction accuracy of the top ten of 5,500 competitors.”